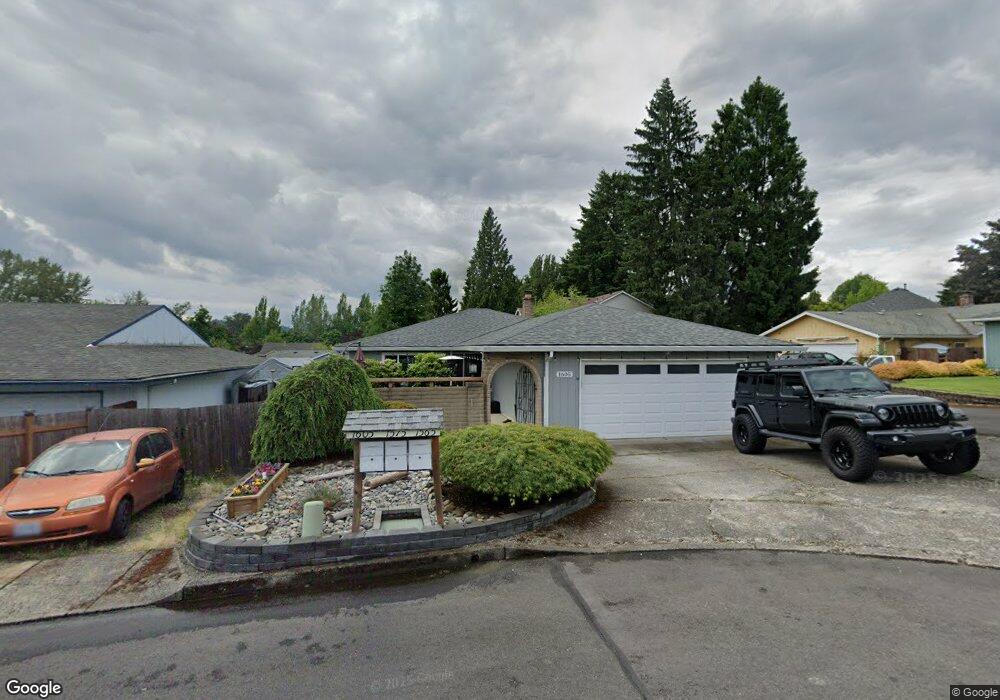
1605 SE Paloma Ct Gresham, OR 97080
Kelly Creek NeighborhoodEstimated Value: $475,000 - $502,000
3
Beds
2
Baths
1,792
Sq Ft
$272/Sq Ft
Est. Value
About This Home
This home is located at 1605 SE Paloma Ct, Gresham, OR 97080 and is currently estimated at $486,820, approximately $271 per square foot. 1605 SE Paloma Ct is a home located in Multnomah County with nearby schools including Kelly Creek Elementary School, Gordon Russell Middle School, and Sam Barlow High School.
Ownership History
Date
Name
Owned For
Owner Type
Purchase Details
Closed on
Mar 19, 2021
Sold by
Ady Richard N
Bought by
Vidito Kathleen M and Vidito Jeffrey P
Current Estimated Value
Purchase Details
Closed on
Feb 25, 2021
Sold by
Ady Richard N and Ady Maudine F
Bought by
Vidito Kathleen M and Vidito Jeffrey P
Purchase Details
Closed on
Dec 6, 2018
Sold by
Vidito Kathie
Bought by
Vidito Jeffrey P
Purchase Details
Closed on
Sep 6, 2007
Sold by
Bethel Billie C
Bought by
Vidito Kathie
Home Financials for this Owner
Home Financials are based on the most recent Mortgage that was taken out on this home.
Original Mortgage
$192,000
Interest Rate
6.67%
Mortgage Type
Purchase Money Mortgage
Purchase Details
Closed on
Apr 23, 2005
Sold by
Hall Kimberly A
Bought by
Bethel Billie C
Home Financials for this Owner
Home Financials are based on the most recent Mortgage that was taken out on this home.
Original Mortgage
$315,000
Interest Rate
4.82%
Mortgage Type
FHA
Purchase Details
Closed on
Nov 9, 2004
Sold by
Bethel Billie C
Bought by
Bethel Billie C and Hall Kimberly A
Create a Home Valuation Report for This Property
The Home Valuation Report is an in-depth analysis detailing your home's value as well as a comparison with similar homes in the area
Home Values in the Area
Average Home Value in this Area
Purchase History
| Date | Buyer | Sale Price | Title Company |
|---|---|---|---|
| Vidito Kathleen M | -- | None Listed On Document | |
| Vidito Kathleen M | -- | None Available | |
| Vidito Jeffrey P | -- | None Available | |
| Vidito Kathie | $240,000 | First American Title Insuran | |
| Bethel Billie C | -- | Chicago Title Insurance Comp | |
| Bethel Billie C | -- | -- |
Source: Public Records
Mortgage History
| Date | Status | Borrower | Loan Amount |
|---|---|---|---|
| Previous Owner | Vidito Kathie | $192,000 | |
| Previous Owner | Bethel Billie C | $315,000 | |
| Closed | Bethel Billie C | $315,000 |
Source: Public Records
Tax History Compared to Growth
Tax History
| Year | Tax Paid | Tax Assessment Tax Assessment Total Assessment is a certain percentage of the fair market value that is determined by local assessors to be the total taxable value of land and additions on the property. | Land | Improvement |
|---|---|---|---|---|
| 2025 | $4,606 | $226,360 | -- | -- |
| 2024 | $4,409 | $219,770 | -- | -- |
| 2023 | $4,017 | $213,370 | $0 | $0 |
| 2022 | $3,905 | $207,160 | $0 | $0 |
| 2021 | $3,807 | $201,130 | $0 | $0 |
| 2020 | $3,582 | $195,280 | $0 | $0 |
| 2019 | $3,488 | $189,600 | $0 | $0 |
| 2018 | $3,326 | $184,080 | $0 | $0 |
| 2017 | $3,191 | $178,720 | $0 | $0 |
| 2016 | $2,813 | $173,520 | $0 | $0 |
| 2015 | $2,753 | $168,470 | $0 | $0 |
| 2014 | $2,686 | $163,570 | $0 | $0 |
Source: Public Records
Map
Nearby Homes
- 1532 SE Barn Owl Way
- 4052 SE 17th St
- 1279 SE Wendy Ave
- 4191 SE 22nd Dr
- 1230 SE Barnes Rd
- 3689 SE 14th St
- 1462 SE Williams Ave
- 2022 SE Williams Dr
- 2098 SE Williams Dr
- 4627 SE 21st Terrace
- 1326 SE Condor Place
- 2433 SE Barnes Rd
- 4753 SE 14th St
- 1536 SE Condor Ave
- 0 SE Powell Valley Rd Unit 257585008
- 2009028 SE Powell Valley Rd Unit 1
- 1534 SE Hale Ct
- 745 SE Wendy Ln
- 2132 SE Douglas Place
- 4732 SE Powell Valley Rd
- 1625 SE Paloma Ct
- 1664 SE Barn Owl Ln
- 1672 SE Barn Owl Ln
- 1575 SE Paloma Ct
- 1658 SE Barn Owl Ln
- 1565 SE Paloma Ct
- 1684 SE Barn Owl Ln
- 1570 SE Paloma Ct
- 1665 SE Paloma Ct
- 1698 SE Barn Owl Ln
- 1620 SE Barn Owl Ln
- 1564 SE Barn Owl Way
- 1548 SE Barn Owl Way
- 1610 SE Paloma Ct
- 4020 SE 15th Ct
- 1628 SE Paloma Ct
- 1670 SE Paloma Ct
- 1716 SE Barn Owl Ln
- 1695 SE Paloma Ct
- 1572 SE Barn Owl Way