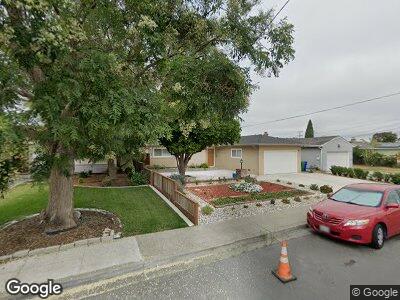
16059 Channel St San Lorenzo, CA 94580
Estimated Value: $780,000 - $850,615
3
Beds
2
Baths
1,100
Sq Ft
$732/Sq Ft
Est. Value
About This Home
This home is located at 16059 Channel St, San Lorenzo, CA 94580 and is currently estimated at $805,654, approximately $732 per square foot. 16059 Channel St is a home located in Alameda County with nearby schools including Bay Elementary School, Bohannon Middle School, and Arroyo High School.
Ownership History
Date
Name
Owned For
Owner Type
Purchase Details
Closed on
May 18, 2009
Sold by
Meza Ismael
Bought by
Palma Hector and Lee Mei
Current Estimated Value
Purchase Details
Closed on
Mar 22, 2006
Sold by
Russo Jose L
Bought by
Meza Ismael
Home Financials for this Owner
Home Financials are based on the most recent Mortgage that was taken out on this home.
Original Mortgage
$494,950
Interest Rate
2.13%
Mortgage Type
Negative Amortization
Purchase Details
Closed on
Feb 14, 2006
Sold by
Meza Sandra Luz
Bought by
Meza Ismael
Home Financials for this Owner
Home Financials are based on the most recent Mortgage that was taken out on this home.
Original Mortgage
$494,950
Interest Rate
2.13%
Mortgage Type
Negative Amortization
Create a Home Valuation Report for This Property
The Home Valuation Report is an in-depth analysis detailing your home's value as well as a comparison with similar homes in the area
Home Values in the Area
Average Home Value in this Area
Purchase History
| Date | Buyer | Sale Price | Title Company |
|---|---|---|---|
| Palma Hector | $290,000 | Fidelity National Title Co | |
| Meza Ismael | $550,000 | Old Republic Title Company | |
| Meza Ismael | -- | Old Republic Title Company |
Source: Public Records
Mortgage History
| Date | Status | Borrower | Loan Amount |
|---|---|---|---|
| Open | Acosta Teofila C | $163,500 | |
| Open | Acosta Edgar D | $300,750 | |
| Previous Owner | Meza Ismael | $494,950 | |
| Previous Owner | Acosta Edgar D | $343,000 | |
| Previous Owner | Acosta Edgar D | $245,000 | |
| Previous Owner | Acosta Edgardo D | $107,132 |
Source: Public Records
Tax History Compared to Growth
Tax History
| Year | Tax Paid | Tax Assessment Tax Assessment Total Assessment is a certain percentage of the fair market value that is determined by local assessors to be the total taxable value of land and additions on the property. | Land | Improvement |
|---|---|---|---|---|
| 2024 | $5,060 | $359,104 | $109,831 | $256,273 |
| 2023 | $5,042 | $358,927 | $107,678 | $251,249 |
| 2022 | $4,960 | $344,891 | $105,567 | $246,324 |
| 2021 | $4,819 | $337,991 | $103,497 | $241,494 |
| 2020 | $4,709 | $341,457 | $102,437 | $239,020 |
| 2019 | $4,707 | $334,764 | $100,429 | $234,335 |
| 2018 | $4,422 | $328,201 | $98,460 | $229,741 |
| 2017 | $4,222 | $321,765 | $96,529 | $225,236 |
| 2016 | $4,025 | $315,458 | $94,637 | $220,821 |
| 2015 | $3,936 | $310,723 | $93,217 | $217,506 |
| 2014 | $3,877 | $304,638 | $91,391 | $213,247 |
Source: Public Records
Map
Nearby Homes
- 1375 Via Faisan
- 1603 Via Lacqua
- 16103 Via Chiquita
- 1599 Bandoni Ave
- 1773 Keller Ave
- 0 E 14th St Unit 41059501
- 1233 Bockman Rd Unit 19
- 17233 Via la Jolla
- 17269 Via la Jolla
- 1560 Vining Dr
- 1723 Via Mesa
- 886 Via Manzanas
- 16087 Via Harriet
- 15966 Via Conejo
- 1515 Via Mesa
- 17039 Via Pasatiempo
- 17328 Via Chiquita
- 1928 Via Buena Vista
- 1943 Vining Dr
- 1958 Vining Dr
- 16059 Channel St
- 16051 Channel St
- 16067 Channel St
- 16060 Via Vecinos
- 16052 Via Vecinos
- 16043 Channel St
- 16075 Channel St
- 16068 Via Vecinos
- 16044 Via Vecinos
- 1475 Via la Paloma
- 16035 Channel St
- 16076 Via Vecinos
- 1475 Vía La Paloma
- 1478 Via la Paloma
- 16083 Channel St
- 16036 Via Vecinos
- 16048 Channel St
- 1459 Via la Paloma
- 16027 Channel St
- 1462 Via la Paloma