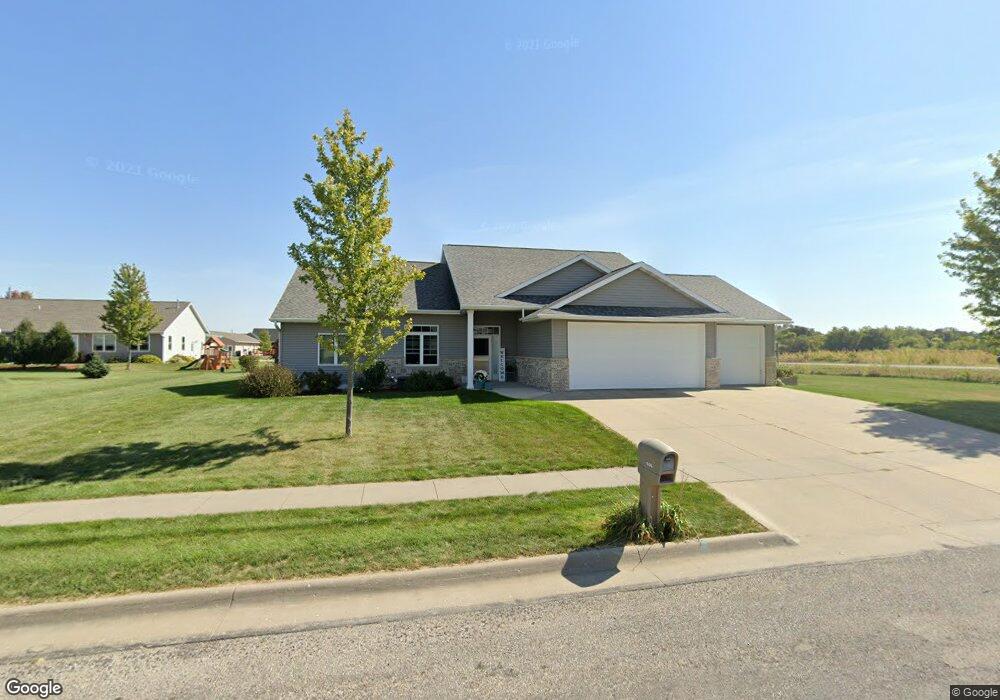
1606 12th Ave Vinton, IA 52349
Estimated Value: $355,000 - $391,000
4
Beds
3
Baths
1,802
Sq Ft
$206/Sq Ft
Est. Value
About This Home
This home is located at 1606 12th Ave, Vinton, IA 52349 and is currently estimated at $370,437, approximately $205 per square foot. 1606 12th Ave is a home with nearby schools including Tilford Elementary School, Shellsburg Elementary School, and Vinton-Shellsburg Middle School.
Ownership History
Date
Name
Owned For
Owner Type
Purchase Details
Closed on
Oct 29, 2024
Sold by
Mullikin Austin and Mullikin Alissa
Bought by
Geater Bradley and Geater Jaye Oneill
Current Estimated Value
Home Financials for this Owner
Home Financials are based on the most recent Mortgage that was taken out on this home.
Original Mortgage
$350,000
Outstanding Balance
$346,136
Interest Rate
6.09%
Mortgage Type
Credit Line Revolving
Estimated Equity
$24,301
Create a Home Valuation Report for This Property
The Home Valuation Report is an in-depth analysis detailing your home's value as well as a comparison with similar homes in the area
Home Values in the Area
Average Home Value in this Area
Purchase History
| Date | Buyer | Sale Price | Title Company |
|---|---|---|---|
| Geater Bradley | $347,000 | None Listed On Document |
Source: Public Records
Mortgage History
| Date | Status | Borrower | Loan Amount |
|---|---|---|---|
| Open | Geater Bradley | $350,000 |
Source: Public Records
Tax History Compared to Growth
Tax History
| Year | Tax Paid | Tax Assessment Tax Assessment Total Assessment is a certain percentage of the fair market value that is determined by local assessors to be the total taxable value of land and additions on the property. | Land | Improvement |
|---|---|---|---|---|
| 2025 | $6,090 | $362,800 | $41,500 | $321,300 |
| 2024 | $6,090 | $335,200 | $40,400 | $294,800 |
| 2023 | $5,752 | $335,200 | $40,400 | $294,800 |
| 2022 | $5,904 | $276,200 | $32,300 | $243,900 |
| 2021 | $5,904 | $276,200 | $32,300 | $243,900 |
| 2020 | $4,494 | $216,500 | $20,500 | $196,000 |
| 2019 | $4,484 | $216,500 | $20,500 | $196,000 |
| 2018 | $4,352 | $213,100 | $19,600 | $193,500 |
| 2017 | $4,352 | $213,100 | $19,600 | $193,500 |
| 2016 | $4,108 | $199,100 | $18,300 | $180,800 |
| 2015 | $4,108 | $199,100 | $18,300 | $180,800 |
| 2014 | $4,070 | $196,900 | $0 | $0 |
Source: Public Records
Map
Nearby Homes