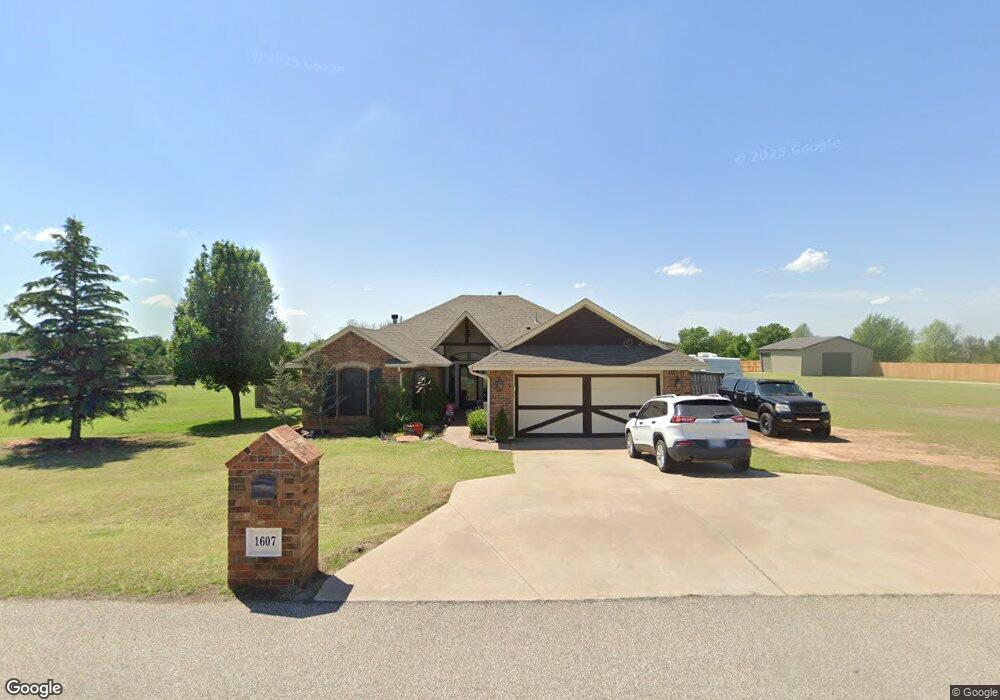
1607 Camelot St Tuttle, OK 73089
Estimated Value: $287,804 - $369,000
3
Beds
2
Baths
1,612
Sq Ft
$198/Sq Ft
Est. Value
About This Home
This home is located at 1607 Camelot St, Tuttle, OK 73089 and is currently estimated at $318,451, approximately $197 per square foot. 1607 Camelot St is a home located in Grady County with nearby schools including Tuttle Elementary School, Tuttle Intermediate School, and Tuttle Middle School.
Ownership History
Date
Name
Owned For
Owner Type
Purchase Details
Closed on
Apr 20, 2009
Sold by
Renaissance Custom Homes Llc
Bought by
Lambrecht Sheldon R
Current Estimated Value
Home Financials for this Owner
Home Financials are based on the most recent Mortgage that was taken out on this home.
Original Mortgage
$157,029
Outstanding Balance
$103,545
Interest Rate
5.84%
Mortgage Type
FHA
Estimated Equity
$214,906
Purchase Details
Closed on
May 23, 2008
Sold by
Richland Hills Development Inc
Bought by
Renaissance Custom Homes Llc
Create a Home Valuation Report for This Property
The Home Valuation Report is an in-depth analysis detailing your home's value as well as a comparison with similar homes in the area
Home Values in the Area
Average Home Value in this Area
Purchase History
| Date | Buyer | Sale Price | Title Company |
|---|---|---|---|
| Lambrecht Sheldon R | $16,000 | None Available | |
| Renaissance Custom Homes Llc | $23,500 | None Available |
Source: Public Records
Mortgage History
| Date | Status | Borrower | Loan Amount |
|---|---|---|---|
| Open | Lambrecht Sheldon R | $157,029 |
Source: Public Records
Tax History Compared to Growth
Tax History
| Year | Tax Paid | Tax Assessment Tax Assessment Total Assessment is a certain percentage of the fair market value that is determined by local assessors to be the total taxable value of land and additions on the property. | Land | Improvement |
|---|---|---|---|---|
| 2025 | $2,408 | $23,857 | $3,093 | $20,764 |
| 2024 | $2,518 | $23,162 | $3,002 | $20,160 |
| 2023 | $2,518 | $22,487 | $3,304 | $19,183 |
| 2022 | $2,283 | $21,781 | $3,304 | $18,477 |
| 2021 | $2,222 | $21,147 | $3,304 | $17,843 |
| 2020 | $2,245 | $21,146 | $3,304 | $17,842 |
| 2019 | $2,139 | $20,530 | $3,304 | $17,226 |
| 2018 | $1,889 | $19,259 | $3,304 | $15,955 |
| 2017 | $1,895 | $18,863 | $3,251 | $15,612 |
| 2016 | $1,871 | $18,313 | $3,192 | $15,121 |
| 2015 | $1,701 | $17,780 | $2,703 | $15,077 |
| 2014 | $1,701 | $17,600 | $2,750 | $14,850 |
Source: Public Records
Map
Nearby Homes
- 0 Frisco Rd
- 00 Chad Dr
- 410 Sky Ln
- 215 N Cemetery Rd
- 509 Cantebury Dr
- 516 Kings Ct
- 508 Kings Ct
- 2 NW 6th St
- 2803 E Sh-37
- 304 SW 5th St
- 401 SW 4th St
- 605 SW 4th St
- 1107 Prairie Hills Dr
- 1301 E Rock Creek Rd
- 825 S Cemetery Rd
- 811 S Cemetery Rd
- 2029 E Rock Creek Rd
- 2025 E Rock Creek Rd
- 803 S Cemetery Rd
- 813 S Cemetery Rd