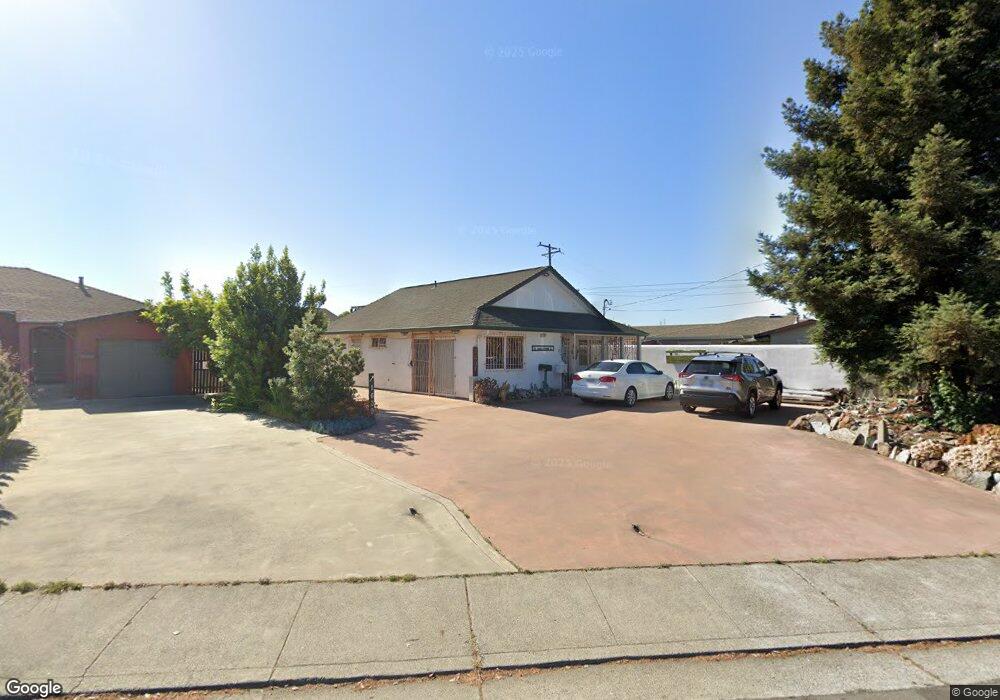
1607 Lemon St Vallejo, CA 94590
West Vallejo NeighborhoodEstimated Value: $404,000 - $477,000
2
Beds
2
Baths
1,136
Sq Ft
$384/Sq Ft
Est. Value
About This Home
This home is located at 1607 Lemon St, Vallejo, CA 94590 and is currently estimated at $435,953, approximately $383 per square foot. 1607 Lemon St is a home located in Solano County with nearby schools including Grace Patterson Elementary School, Vallejo High School, and St. Basil Catholic School.
Ownership History
Date
Name
Owned For
Owner Type
Purchase Details
Closed on
Dec 30, 2014
Sold by
Eggleston Alan K and Mccormack Rhea M
Bought by
Eggleston Mccormack Family 2014 Living T and Mccormack Rhea M
Current Estimated Value
Purchase Details
Closed on
Oct 11, 2007
Sold by
Eggleston Alan Kirk
Bought by
Eggleston Alan K
Purchase Details
Closed on
Oct 23, 1996
Sold by
Pappas Mark Basil
Bought by
Eggleston Alan Kirk
Create a Home Valuation Report for This Property
The Home Valuation Report is an in-depth analysis detailing your home's value as well as a comparison with similar homes in the area
Home Values in the Area
Average Home Value in this Area
Purchase History
| Date | Buyer | Sale Price | Title Company |
|---|---|---|---|
| Eggleston Mccormack Family 2014 Living T | -- | None Available | |
| Eggleston Alan K | -- | None Available | |
| Eggleston Alan K | -- | None Available | |
| Eggleston Alan Kirk | $30,500 | North American Title Co |
Source: Public Records
Tax History Compared to Growth
Tax History
| Year | Tax Paid | Tax Assessment Tax Assessment Total Assessment is a certain percentage of the fair market value that is determined by local assessors to be the total taxable value of land and additions on the property. | Land | Improvement |
|---|---|---|---|---|
| 2025 | $3,359 | $200,986 | $47,224 | $153,762 |
| 2024 | $3,359 | $197,047 | $46,299 | $150,748 |
| 2023 | $3,140 | $193,185 | $45,392 | $147,793 |
| 2022 | $3,039 | $189,398 | $44,503 | $144,895 |
| 2021 | $2,970 | $185,685 | $43,631 | $142,054 |
| 2020 | $2,972 | $183,782 | $43,184 | $140,598 |
| 2019 | $2,870 | $180,180 | $42,338 | $137,842 |
| 2018 | $2,679 | $176,648 | $41,508 | $135,140 |
| 2017 | $2,549 | $173,186 | $40,695 | $132,491 |
| 2016 | $1,979 | $169,792 | $39,898 | $129,894 |
| 2015 | $1,953 | $167,242 | $39,299 | $127,943 |
| 2014 | $1,926 | $163,967 | $38,530 | $125,437 |
Source: Public Records
Map
Nearby Homes