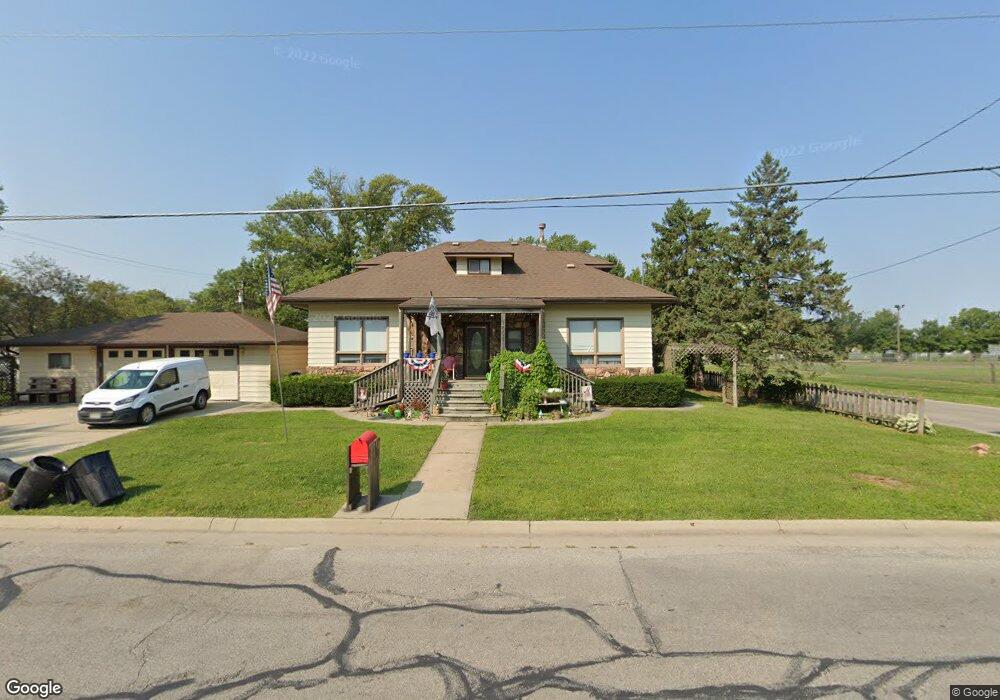
1607 N 4th St Red Oak, IA 51566
Estimated Value: $157,000 - $198,461
3
Beds
2
Baths
2,067
Sq Ft
$85/Sq Ft
Est. Value
About This Home
This home is located at 1607 N 4th St, Red Oak, IA 51566 and is currently estimated at $175,365, approximately $84 per square foot. 1607 N 4th St is a home located in Montgomery County with nearby schools including Red Oak Early Childhood Center, Red Oak Middle School, and Red Oak Junior/Senior High School.
Ownership History
Date
Name
Owned For
Owner Type
Purchase Details
Closed on
Oct 6, 2017
Sold by
Tiger 111 Partnership
Bought by
Hunt Angela S
Current Estimated Value
Purchase Details
Closed on
Jun 10, 2011
Sold by
Estate Of Virginia A Rees
Bought by
Hankins Stephen M
Home Financials for this Owner
Home Financials are based on the most recent Mortgage that was taken out on this home.
Original Mortgage
$90,900
Interest Rate
4.8%
Mortgage Type
New Conventional
Create a Home Valuation Report for This Property
The Home Valuation Report is an in-depth analysis detailing your home's value as well as a comparison with similar homes in the area
Home Values in the Area
Average Home Value in this Area
Purchase History
| Date | Buyer | Sale Price | Title Company |
|---|---|---|---|
| Hunt Angela S | $60,000 | None Available | |
| Hankins Stephen M | $92,000 | -- |
Source: Public Records
Mortgage History
| Date | Status | Borrower | Loan Amount |
|---|---|---|---|
| Previous Owner | Hankins Stephen M | $90,900 |
Source: Public Records
Tax History Compared to Growth
Tax History
| Year | Tax Paid | Tax Assessment Tax Assessment Total Assessment is a certain percentage of the fair market value that is determined by local assessors to be the total taxable value of land and additions on the property. | Land | Improvement |
|---|---|---|---|---|
| 2025 | $3,798 | $179,860 | $19,310 | $160,550 |
| 2024 | $3,646 | $161,870 | $10,940 | $150,930 |
| 2023 | $2,788 | $161,870 | $10,940 | $150,930 |
| 2022 | $2,620 | $103,350 | $10,940 | $92,410 |
| 2021 | $2,600 | $103,350 | $10,940 | $92,410 |
| 2020 | $2,600 | $97,570 | $10,940 | $86,630 |
| 2019 | $2,872 | $97,570 | $10,940 | $86,630 |
| 2018 | $2,762 | $109,120 | $0 | $0 |
| 2017 | $2,762 | $109,120 | $0 | $0 |
| 2015 | $2,612 | $103,180 | $0 | $0 |
| 2014 | $2,554 | $103,180 | $0 | $0 |
Source: Public Records
Map
Nearby Homes