Estimated Value: $600,890 - $666,000
--
Bed
3
Baths
2,332
Sq Ft
$270/Sq Ft
Est. Value
About This Home
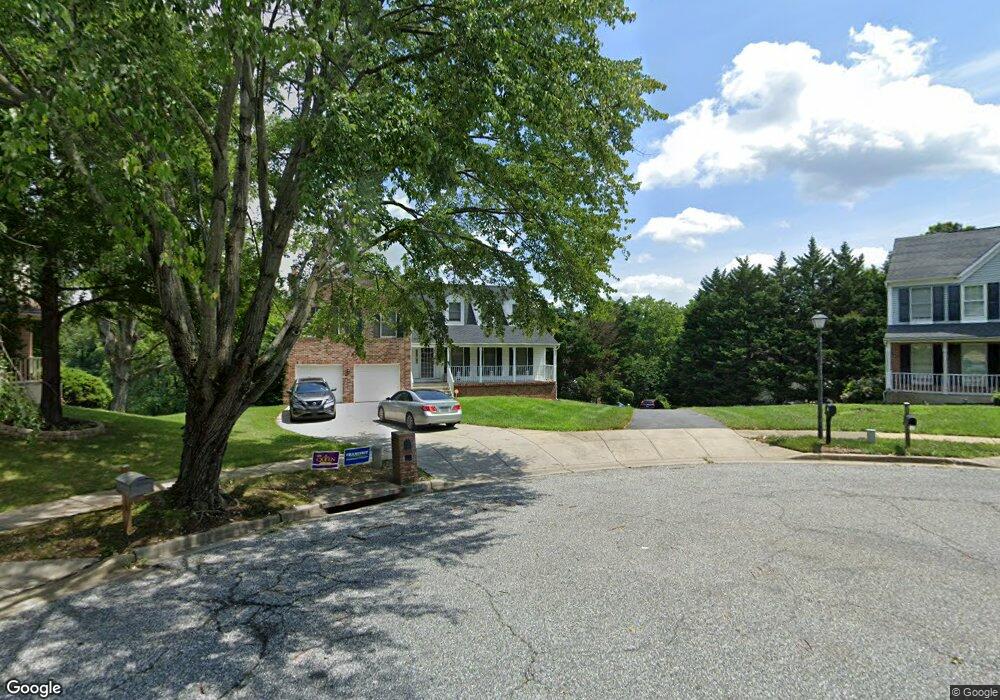
This home is located at 1607 Pebble Beach Ct, Bowie, MD 20721 and is currently estimated at $628,723, approximately $269 per square foot. 1607 Pebble Beach Ct is a home located in Prince George's County with nearby schools including Lake Arbor Elementary, Ernest Everett Just Middle, and Charles Herbert Flowers High School.
Ownership History
Date
Name
Owned For
Owner Type
Purchase Details
Closed on
Nov 10, 2016
Bought by
Compton Hilda and Compton Mark
Current Estimated Value
Home Financials for this Owner
Home Financials are based on the most recent Mortgage that was taken out on this home.
Original Mortgage
$318,534
Outstanding Balance
$256,252
Interest Rate
3.57%
Estimated Equity
$372,471
Purchase Details
Closed on
Jan 12, 2005
Sold by
Herndonmichael E Trust
Bought by
Compton Mark
Home Financials for this Owner
Home Financials are based on the most recent Mortgage that was taken out on this home.
Original Mortgage
$333,700
Interest Rate
5.84%
Mortgage Type
New Conventional
Purchase Details
Closed on
Jan 24, 2002
Sold by
Herndon Michael E
Bought by
Herndonmichael E Trust
Purchase Details
Closed on
Jul 22, 1991
Sold by
Boston Joint
Bought by
Herndon Michael E
Create a Home Valuation Report for This Property
The Home Valuation Report is an in-depth analysis detailing your home's value as well as a comparison with similar homes in the area
Home Values in the Area
Average Home Value in this Area
Purchase History
| Date | Buyer | Sale Price | Title Company |
|---|---|---|---|
| Compton Hilda | -- | -- | |
| Compton Mark | $438,000 | -- | |
| Herndonmichael E Trust | -- | -- | |
| Herndon Michael E | $275,000 | -- |
Source: Public Records
Mortgage History
| Date | Status | Borrower | Loan Amount |
|---|---|---|---|
| Open | Compton Mark | $318,534 | |
| Closed | Compton Mark | -- | |
| Previous Owner | Compton Mark | $333,700 | |
| Previous Owner | Compton Mark | $100,000 |
Source: Public Records
Tax History Compared to Growth
Tax History
| Year | Tax Paid | Tax Assessment Tax Assessment Total Assessment is a certain percentage of the fair market value that is determined by local assessors to be the total taxable value of land and additions on the property. | Land | Improvement |
|---|---|---|---|---|
| 2025 | $6,004 | $528,900 | -- | -- |
| 2024 | $6,004 | $472,500 | $0 | $0 |
| 2023 | $4,627 | $416,100 | $102,600 | $313,500 |
| 2022 | $5,508 | $409,767 | $0 | $0 |
| 2021 | $5,329 | $403,433 | $0 | $0 |
| 2020 | $5,269 | $397,100 | $101,300 | $295,800 |
| 2019 | $5,126 | $379,600 | $0 | $0 |
| 2018 | $4,957 | $362,100 | $0 | $0 |
| 2017 | $4,817 | $344,600 | $0 | $0 |
| 2016 | -- | $318,533 | $0 | $0 |
| 2015 | $5,484 | $292,467 | $0 | $0 |
| 2014 | $5,484 | $266,400 | $0 | $0 |
Source: Public Records
Map
Nearby Homes
- 1710 Pebble Beach Dr
- 1805 Albert Ct
- 11505 Chesley Ct
- 11035 Spyglass Hill Ct
- 1006 Winged Foot Dr
- 10304 Sea Pines Dr
- 2101 Waterleaf Way
- 11407 Waesche Dr
- 1705 Barrington Ct
- 11110 Inverrary Ct
- 913 Westlake Dr
- 1758 Albert Dr
- 1703 Stourbridge Ct
- 1701 Stourbridge Ct
- 10749 Kitchener Ct
- 806 Congressional Ct
- 918 Lake Overlook Dr
- 932 Lake Overlook Dr
- 10518 Beacon Ridge Dr Unit 14-302
- 1019 Summerglenn Ct Unit 7-302
- 1606 Pebble Beach Ct
- 10924 Golf Course Terrace
- 1605 Pebble Beach Ct
- 10923 Golf Course Terrace
- 1604 Pebble Beach Ct
- 1603 Pebble Beach Ct
- 10922 Golf Course Terrace
- 1602 Pebble Beach Ct
- 10921 Golf Course Terrace
- 1509 Pebble Beach Dr
- 1507 Pebble Beach Dr
- 1607 Pebble Beach Dr
- 1601 Pebble Beach Dr
- 10920 Golf Course Terrace
- 1609 Pebble Beach Dr
- 10919 Golf Course Terrace
- 1505 Pebble Beach Dr
- 1603 Pebble Beach Dr
- 1605 Pebble Beach Dr
- 1503 Pebble Beach Dr