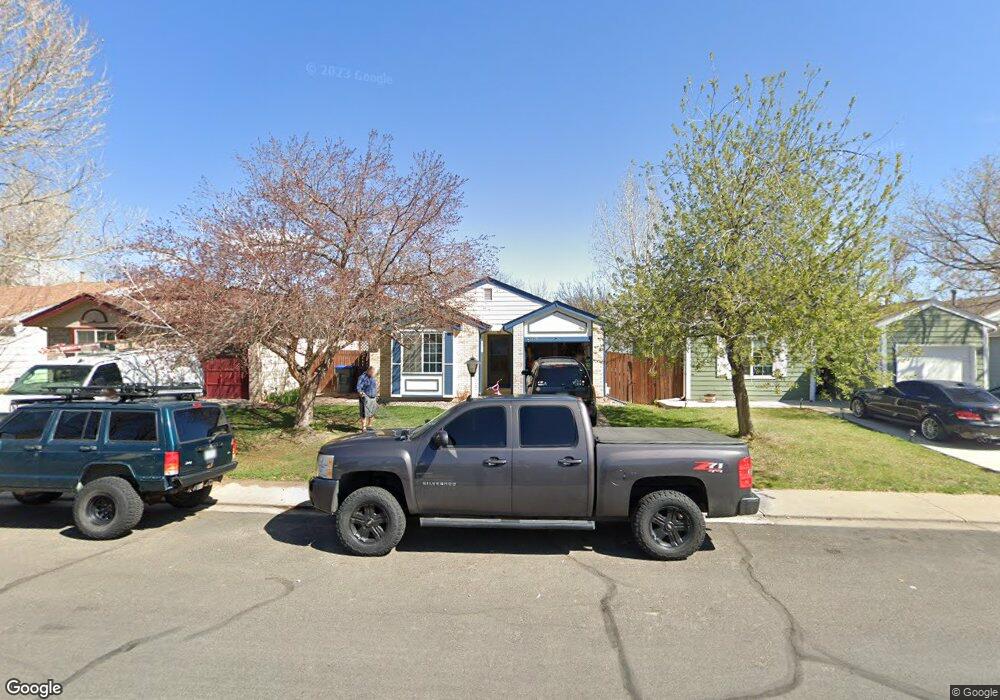
1608 19th Ave Longmont, CO 80501
Garden Acres NeighborhoodEstimated Value: $397,269 - $415,000
2
Beds
1
Bath
882
Sq Ft
$463/Sq Ft
Est. Value
About This Home
This home is located at 1608 19th Ave, Longmont, CO 80501 and is currently estimated at $408,567, approximately $463 per square foot. 1608 19th Ave is a home located in Boulder County with nearby schools including Northridge Elementary School, Longs Peak Middle School, and Longmont High School.
Ownership History
Date
Name
Owned For
Owner Type
Purchase Details
Closed on
Nov 13, 2014
Sold by
Grimaldi Anthony J
Bought by
Grimaldi Services Llc
Current Estimated Value
Purchase Details
Closed on
Aug 22, 2002
Sold by
Spicer Lori Ann
Bought by
Grimaldi Anthony J
Home Financials for this Owner
Home Financials are based on the most recent Mortgage that was taken out on this home.
Original Mortgage
$100,000
Outstanding Balance
$42,073
Interest Rate
6.47%
Estimated Equity
$366,494
Purchase Details
Closed on
Mar 21, 1997
Sold by
Sathra Kenneth J
Bought by
Spicer Lori A
Home Financials for this Owner
Home Financials are based on the most recent Mortgage that was taken out on this home.
Original Mortgage
$104,346
Interest Rate
7.55%
Mortgage Type
FHA
Purchase Details
Closed on
May 4, 1993
Bought by
Grimaldi Services Llc
Purchase Details
Closed on
Jan 4, 1989
Bought by
Grimaldi Services Llc
Purchase Details
Closed on
Sep 6, 1988
Bought by
Grimaldi Services Llc
Create a Home Valuation Report for This Property
The Home Valuation Report is an in-depth analysis detailing your home's value as well as a comparison with similar homes in the area
Home Values in the Area
Average Home Value in this Area
Purchase History
| Date | Buyer | Sale Price | Title Company |
|---|---|---|---|
| Grimaldi Services Llc | -- | None Available | |
| Grimaldi Anthony J | $166,000 | -- | |
| Spicer Lori A | $105,000 | -- | |
| Grimaldi Services Llc | $82,000 | -- | |
| Grimaldi Services Llc | -- | -- | |
| Grimaldi Services Llc | -- | -- |
Source: Public Records
Mortgage History
| Date | Status | Borrower | Loan Amount |
|---|---|---|---|
| Open | Grimaldi Anthony J | $100,000 | |
| Previous Owner | Spicer Lori A | $104,346 |
Source: Public Records
Tax History Compared to Growth
Tax History
| Year | Tax Paid | Tax Assessment Tax Assessment Total Assessment is a certain percentage of the fair market value that is determined by local assessors to be the total taxable value of land and additions on the property. | Land | Improvement |
|---|---|---|---|---|
| 2025 | $2,018 | $22,631 | $4,325 | $18,306 |
| 2024 | $2,018 | $22,631 | $4,325 | $18,306 |
| 2023 | $1,991 | $21,098 | $4,858 | $19,926 |
| 2022 | $1,894 | $19,136 | $3,572 | $15,564 |
| 2021 | $1,918 | $19,687 | $3,675 | $16,012 |
| 2020 | $1,876 | $19,312 | $3,146 | $16,166 |
| 2019 | $1,846 | $19,312 | $3,146 | $16,166 |
| 2018 | $1,442 | $15,185 | $2,808 | $12,377 |
| 2017 | $1,423 | $16,787 | $3,104 | $13,683 |
| 2016 | $1,287 | $13,468 | $3,900 | $9,568 |
| 2015 | $1,227 | $11,367 | $3,582 | $7,785 |
| 2014 | $1,062 | $11,367 | $3,582 | $7,785 |
Source: Public Records
Map
Nearby Homes
- 1614 Ervine Ave
- 1554 Ervine Ave
- 0 Francis St
- 1408 17th Ave
- 1838 Gay St
- 1313 Garden Cir
- 2108 Tulip St
- 2172 Hackberry Cir
- 2244 Vivian St
- 1736 Trevor Ct
- 2104 18th Ave
- 2155 Hackberry Cir
- 1851 Trevor Cir
- 1838 Queens Dr
- 1855 Trevor Cir
- 2160 Sumac St
- 1626 Tulip Ct
- 1211 16th Ave
- 1365 15th Ave
- 1005 Harmon Place
- 1612 19th Ave
- 1604 19th Ave
- 1616 19th Ave
- 1600 19th Ave
- 1611 Calkins Ave
- 1607 Calkins Ave
- 1615 Calkins Ave
- 1620 19th Ave
- 1603 Calkins Ave
- 1619 Calkins Ave
- 1609 19th Ave
- 1624 19th Ave
- 1623 Calkins Ave
- 1605 19th Ave
- 1613 19th Ave
- 1617 19th Ave
- 1601 19th Ave
- 1627 Calkins Ave
- 1621 19th Ave
- 1904 Sumner St