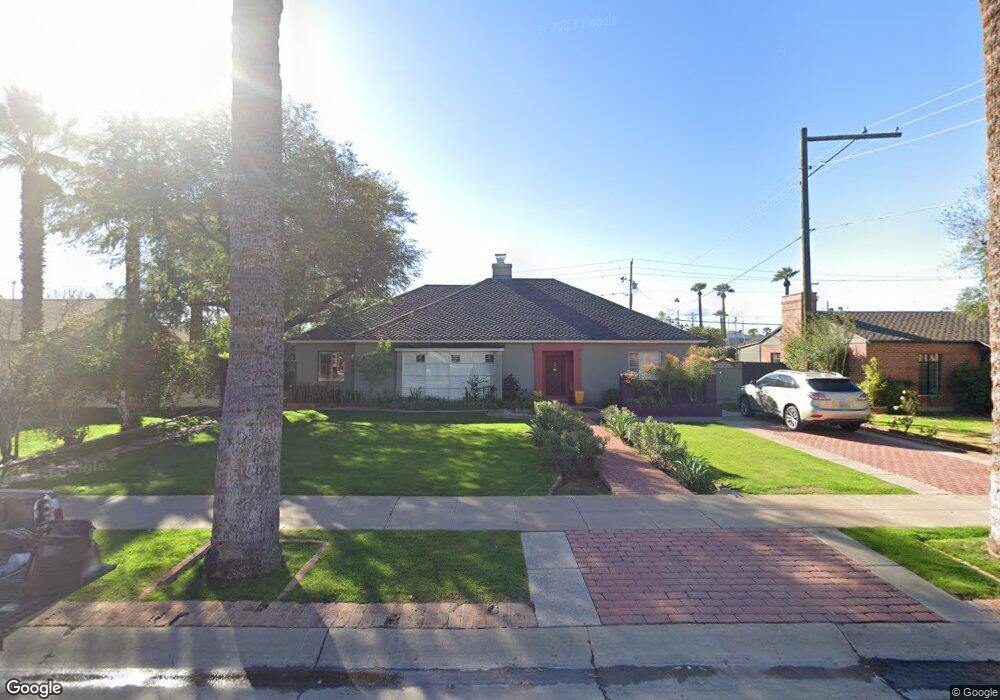
1608 Palmcroft Way SE Phoenix, AZ 85007
Encanto-Palmcroft NeighborhoodEstimated Value: $912,000 - $1,127,000
2
Beds
2
Baths
2,022
Sq Ft
$490/Sq Ft
Est. Value
About This Home
This home is located at 1608 Palmcroft Way SE, Phoenix, AZ 85007 and is currently estimated at $991,477, approximately $490 per square foot. 1608 Palmcroft Way SE is a home located in Maricopa County with nearby schools including Kenilworth Elementary School, Phoenix Coding Academy, and Central High School.
Ownership History
Date
Name
Owned For
Owner Type
Purchase Details
Closed on
Aug 4, 2016
Sold by
Sloan Nancy L
Bought by
Sloan Nancy L
Current Estimated Value
Purchase Details
Closed on
Dec 20, 2004
Sold by
Wells Fargo Bank Na and Carlock Robert H
Bought by
Carlock Myra H
Home Financials for this Owner
Home Financials are based on the most recent Mortgage that was taken out on this home.
Original Mortgage
$289,600
Interest Rate
5%
Mortgage Type
Purchase Money Mortgage
Purchase Details
Closed on
Dec 16, 2004
Sold by
Carlock Myra H
Bought by
Sloan Nancy
Home Financials for this Owner
Home Financials are based on the most recent Mortgage that was taken out on this home.
Original Mortgage
$289,600
Interest Rate
5%
Mortgage Type
Purchase Money Mortgage
Purchase Details
Closed on
Aug 27, 1997
Sold by
Carlock George Read and Carlock Robert H
Bought by
Wells Fargo Bank Na and Myra H Carlock Survivors Trust
Create a Home Valuation Report for This Property
The Home Valuation Report is an in-depth analysis detailing your home's value as well as a comparison with similar homes in the area
Home Values in the Area
Average Home Value in this Area
Purchase History
| Date | Buyer | Sale Price | Title Company |
|---|---|---|---|
| Sloan Nancy L | -- | None Available | |
| Carlock Myra H | -- | Security Title Agency Inc | |
| Sloan Nancy | $362,000 | Security Title Agency Inc | |
| Wells Fargo Bank Na | -- | -- |
Source: Public Records
Mortgage History
| Date | Status | Borrower | Loan Amount |
|---|---|---|---|
| Previous Owner | Sloan Nancy | $289,600 |
Source: Public Records
Tax History Compared to Growth
Tax History
| Year | Tax Paid | Tax Assessment Tax Assessment Total Assessment is a certain percentage of the fair market value that is determined by local assessors to be the total taxable value of land and additions on the property. | Land | Improvement |
|---|---|---|---|---|
| 2025 | $2,768 | $19,488 | -- | -- |
| 2024 | $2,581 | $18,560 | -- | -- |
| 2023 | $2,581 | $36,265 | $7,250 | $29,015 |
| 2022 | $2,489 | $26,700 | $5,340 | $21,360 |
| 2021 | $2,470 | $27,250 | $5,450 | $21,800 |
| 2020 | $2,499 | $25,190 | $5,035 | $20,155 |
| 2019 | $2,495 | $23,455 | $4,690 | $18,765 |
| 2018 | $2,853 | $24,000 | $4,800 | $19,200 |
| 2017 | $2,786 | $22,425 | $4,485 | $17,940 |
| 2016 | $2,707 | $19,810 | $3,960 | $15,850 |
| 2015 | $2,504 | $20,760 | $4,150 | $16,610 |
Source: Public Records
Map
Nearby Homes
- 1615 Palmcroft Way SE
- 1808 N 13th Ave
- 1614 Palmcroft Way SE
- 1625 Palmcroft Way SW
- 2002 N 13th Ave
- 1515 N 15th Ave
- 1614 Palmcroft Dr SW
- 2020 N 11th Ave
- 1603 Palmcroft Dr SE
- 1514 W Lynwood St
- 1621 N 16th Ave
- 1552 W Mcdowell Rd
- 2209 N 12th Ave
- 909 W Willetta St
- 1820 N 7th Ave
- 1706 N 17th Ave
- 1538 W Culver St
- 1842 N 17th Ave
- 2230 N Laurel Ave
- 2227 N 16th Ave
- 1604 Palmcroft Way SE
- 1604 Palmcroft Way NW
- 1611 N 13th Ave
- 1130 W Mcdowell Rd
- 1607 Palmcroft Way SE
- 1134 W Mcdowell Rd
- 1601 N 13th Ave
- 1601 Palmcroft Way SE
- 1122 W Mcdowell Rd
- 1622 Palmcroft Way SE
- 1602 Palmcroft Way SW
- 1118 W Mcdowell Rd
- 1626 Palmcroft Way SE
- 1601 Palmcroft Way SW
- 1631 N 13th Ave
- 1114 W Mcdowell Rd
- 1608 Palmcroft Way SW
- 1630 Palmcroft Way SE
- 1239 W Coronado Rd
- 1632 N 13th Ave