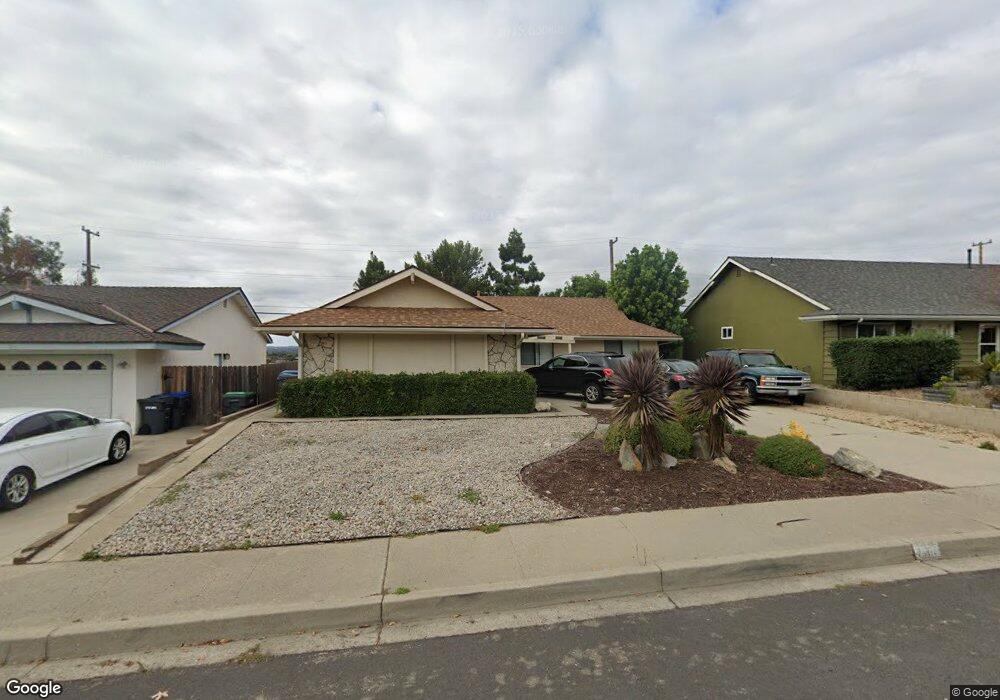
1609 Berkeley Dr Lompoc, CA 93436
Estimated Value: $451,000 - $584,000
4
Beds
3
Baths
1,337
Sq Ft
$401/Sq Ft
Est. Value
About This Home
This home is located at 1609 Berkeley Dr, Lompoc, CA 93436 and is currently estimated at $535,690, approximately $400 per square foot. 1609 Berkeley Dr is a home located in Santa Barbara County with nearby schools including Arthur Hapgood Elementary School, Lompoc Valley Middle School, and Lompoc High School.
Ownership History
Date
Name
Owned For
Owner Type
Purchase Details
Closed on
Jul 13, 2021
Sold by
Bratcher Nanci E and The Naomi L Pelsinger Trust
Bought by
Boucher Aaron and Boucher Kristina
Current Estimated Value
Home Financials for this Owner
Home Financials are based on the most recent Mortgage that was taken out on this home.
Original Mortgage
$322,500
Outstanding Balance
$292,619
Interest Rate
2.9%
Mortgage Type
New Conventional
Estimated Equity
$243,071
Purchase Details
Closed on
Nov 3, 2015
Sold by
Pelsinger Naomi Lynn
Bought by
Pelsinger Naomi L
Purchase Details
Closed on
Jul 31, 2001
Sold by
Jansson Axel E and Jansson Lillian L
Bought by
Pelsinger Naomi Lynn
Home Financials for this Owner
Home Financials are based on the most recent Mortgage that was taken out on this home.
Original Mortgage
$115,000
Interest Rate
7.19%
Create a Home Valuation Report for This Property
The Home Valuation Report is an in-depth analysis detailing your home's value as well as a comparison with similar homes in the area
Home Values in the Area
Average Home Value in this Area
Purchase History
| Date | Buyer | Sale Price | Title Company |
|---|---|---|---|
| Boucher Aaron | $430,000 | First American Title | |
| Pelsinger Naomi L | -- | None Available | |
| Pelsinger Naomi Lynn | $244,000 | First American Title |
Source: Public Records
Mortgage History
| Date | Status | Borrower | Loan Amount |
|---|---|---|---|
| Open | Boucher Aaron | $322,500 | |
| Previous Owner | Pelsinger Naomi Lynn | $115,000 |
Source: Public Records
Tax History
| Year | Tax Paid | Tax Assessment Tax Assessment Total Assessment is a certain percentage of the fair market value that is determined by local assessors to be the total taxable value of land and additions on the property. | Land | Improvement |
|---|---|---|---|---|
| 2025 | $4,970 | $456,319 | $137,957 | $318,362 |
| 2023 | $4,970 | $438,600 | $132,600 | $306,000 |
| 2022 | $4,885 | $430,000 | $130,000 | $300,000 |
| 2021 | $3,830 | $332,995 | $109,174 | $223,821 |
| 2020 | $3,789 | $329,581 | $108,055 | $221,526 |
| 2019 | $3,725 | $323,120 | $105,937 | $217,183 |
| 2018 | $3,666 | $316,785 | $103,860 | $212,925 |
| 2017 | $3,598 | $310,574 | $101,824 | $208,750 |
| 2016 | $3,532 | $304,485 | $99,828 | $204,657 |
| 2015 | $3,504 | $299,912 | $98,329 | $201,583 |
| 2014 | $3,454 | $294,038 | $96,403 | $197,635 |
Source: Public Records
Map
Nearby Homes
- 124 Princeton Place
- 209 S 7th St
- 1416 E Walnut Ave
- 1601 Barrington Ct
- 1200 Peach Ave
- 1204 E Walnut Ave Unit B
- 1309 E Olive Ave
- 1725 Autumn Sage Place
- 1741 River Vista Way
- 1744 River Vista Way
- 1742 River Vista Way
- 1740 River Vista Way
- 523 Live Oak Rd
- 535 Live Oak Rd
- 1739 River Vista Way
- 1729 Autumn Sage Place
- 525 Live Oak Rd
- 1730 Autumn Sage Place
- 1726 Autumn Sage Place
- 1727 Autumn Sage Place
- 1613 Berkeley Dr
- 1605 Berkeley Dr
- 1601 Berkeley Dr
- 1617 Berkeley Dr
- 101 Huntington Place
- 1521 Berkeley Dr
- 1701 Berkeley Dr
- 1517 Berkeley Dr
- 109 Huntington Place
- 100 Huntington Place
- 1513 Berkeley Dr
- 1709 Berkeley Dr
- 104 Huntington Place
- 108 Huntington Place
- 1509 Berkeley Dr
- 101 Princeton Place
- 1713 Berkeley Dr
- 117 Huntington Place
Your Personal Tour Guide
Ask me questions while you tour the home.