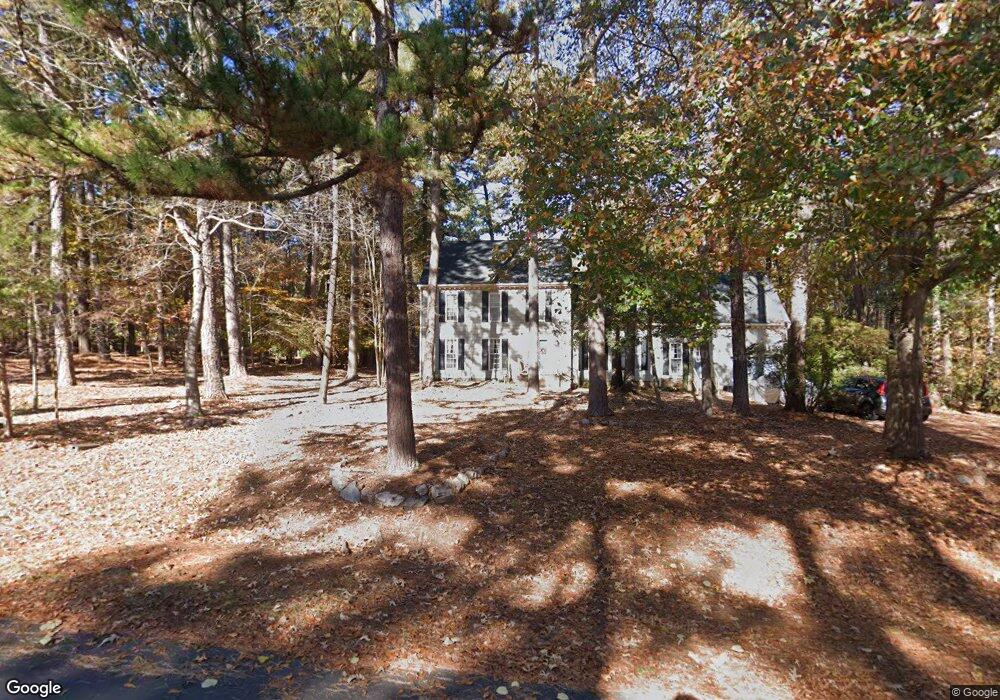
1609 Brook Run Dr Raleigh, NC 27614
Falls Lake NeighborhoodEstimated Value: $638,000 - $695,000
--
Bed
3
Baths
2,662
Sq Ft
$248/Sq Ft
Est. Value
About This Home
This home is located at 1609 Brook Run Dr, Raleigh, NC 27614 and is currently estimated at $661,246, approximately $248 per square foot. 1609 Brook Run Dr is a home located in Wake County with nearby schools including Brassfield Elementary School, West Millbrook Middle School, and Millbrook High School.
Ownership History
Date
Name
Owned For
Owner Type
Purchase Details
Closed on
Jul 3, 2024
Sold by
Bustillos Linda Marie and Moore Marilyn L
Bought by
Tapp Amanda Blythe
Current Estimated Value
Home Financials for this Owner
Home Financials are based on the most recent Mortgage that was taken out on this home.
Original Mortgage
$405,000
Outstanding Balance
$400,116
Interest Rate
6.94%
Mortgage Type
New Conventional
Estimated Equity
$261,130
Purchase Details
Closed on
Jun 30, 2017
Sold by
Moore Marilyn L and Bustillos Linda Marie
Bought by
Moore Marilyn L and Bustillos Linda Marie
Purchase Details
Closed on
Jun 26, 2015
Sold by
Scott Kimberly Ann
Bought by
Moore Robert A and Moore Marilyn L
Purchase Details
Closed on
Jun 17, 2009
Sold by
Moore Robert A and Moore Marilyn L
Bought by
Bustillos Linda Marie and Scott Kimberly Ann
Purchase Details
Closed on
Sep 7, 1984
Bought by
Moore Robert A and Moore Marilyn L
Create a Home Valuation Report for This Property
The Home Valuation Report is an in-depth analysis detailing your home's value as well as a comparison with similar homes in the area
Home Values in the Area
Average Home Value in this Area
Purchase History
| Date | Buyer | Sale Price | Title Company |
|---|---|---|---|
| Tapp Amanda Blythe | $565,000 | None Listed On Document | |
| Moore Marilyn L | -- | None Available | |
| Moore Robert A | -- | Attorney | |
| Bustillos Linda Marie | -- | None Available | |
| Moore Robert A | $138,000 | -- |
Source: Public Records
Mortgage History
| Date | Status | Borrower | Loan Amount |
|---|---|---|---|
| Open | Tapp Amanda Blythe | $405,000 |
Source: Public Records
Tax History Compared to Growth
Tax History
| Year | Tax Paid | Tax Assessment Tax Assessment Total Assessment is a certain percentage of the fair market value that is determined by local assessors to be the total taxable value of land and additions on the property. | Land | Improvement |
|---|---|---|---|---|
| 2025 | $3,522 | $547,594 | $200,000 | $347,594 |
| 2024 | $3,421 | $547,594 | $200,000 | $347,594 |
| 2023 | $2,522 | $320,949 | $82,000 | $238,949 |
| 2022 | $2,338 | $320,949 | $82,000 | $238,949 |
| 2021 | $2,275 | $320,949 | $82,000 | $238,949 |
| 2020 | $2,238 | $320,949 | $82,000 | $238,949 |
| 2019 | $2,281 | $276,838 | $96,000 | $180,838 |
| 2018 | $2,097 | $276,838 | $96,000 | $180,838 |
| 2017 | $1,988 | $276,838 | $96,000 | $180,838 |
| 2016 | $1,948 | $276,838 | $96,000 | $180,838 |
| 2015 | $2,107 | $300,543 | $98,000 | $202,543 |
| 2014 | $1,998 | $300,543 | $98,000 | $202,543 |
Source: Public Records
Map
Nearby Homes
- 12301 Hardee Rd
- 1508 Acres Way
- 1421 Alpine Creek Dr
- 12712 Lindley Dr
- 1209 Ravens Point Cir
- 6820 Brixley Cir
- 5420 Deer Forest Trail
- 12812 Lindley Dr
- 6729 Greywalls Ln
- 308 Swans Mill Crossing
- 15517 Possum Track Rd
- 11100 Honeycutt Rd
- 600 Brittany Bay E
- 12317 Lockhart Ln
- 904 Stonecutter Ct
- 900 Stonecutter Ct
- 9925 Koupela Dr
- 12037 Deer Run
- 1317 Woodgate Manor Ct
- 1301 Glenden Falls Way
- 1613 Brook Run Dr
- 1605 Brook Run Dr
- 1608 Briarwood Place
- 1604 Briarwood Place
- 1608 Brook Run Dr
- 1612 Brook Run Dr
- 1612 Briarwood Place
- 1604 Brook Run Dr
- 1617 Brook Run Dr
- 1616 Brook Run Dr
- 1601 Brook Run Dr
- 1600 Briarwood Place
- 12309 Hardee Rd
- 1620 Brook Run Dr
- 1616 Briarwood Place
- 12313 Hardee Rd
- 12305 Hardee Rd
- 1605 Briarwood Place
- 1600 Brook Run Dr
- 1621 Brook Run Dr