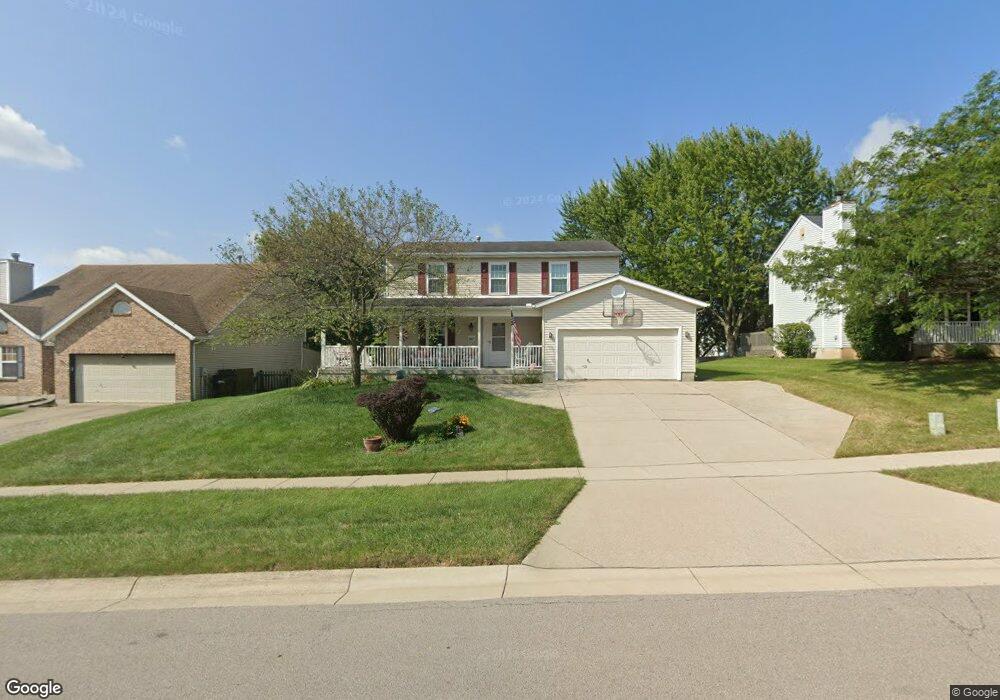
1609 Cantebury Ln Lebanon, OH 45036
Estimated Value: $332,000 - $349,000
4
Beds
3
Baths
1,792
Sq Ft
$191/Sq Ft
Est. Value
About This Home
This home is located at 1609 Cantebury Ln, Lebanon, OH 45036 and is currently estimated at $341,894, approximately $190 per square foot. 1609 Cantebury Ln is a home located in Warren County with nearby schools including Bowman Primary School, Berry Intermediate School, and Donovan Elementary School.
Ownership History
Date
Name
Owned For
Owner Type
Purchase Details
Closed on
Nov 21, 1997
Sold by
Reber Frederick J
Bought by
Figary Raymond L and Figary Debbie L
Current Estimated Value
Home Financials for this Owner
Home Financials are based on the most recent Mortgage that was taken out on this home.
Original Mortgage
$52,500
Interest Rate
7.38%
Mortgage Type
New Conventional
Purchase Details
Closed on
May 22, 1995
Sold by
Lauralex Homes Inc
Bought by
Reber Frederick J and Reber Mary A
Home Financials for this Owner
Home Financials are based on the most recent Mortgage that was taken out on this home.
Original Mortgage
$110,150
Interest Rate
8%
Mortgage Type
New Conventional
Purchase Details
Closed on
Feb 17, 1995
Sold by
Wesreal Inc
Bought by
Lauralex Homes Inc
Create a Home Valuation Report for This Property
The Home Valuation Report is an in-depth analysis detailing your home's value as well as a comparison with similar homes in the area
Home Values in the Area
Average Home Value in this Area
Purchase History
| Date | Buyer | Sale Price | Title Company |
|---|---|---|---|
| Figary Raymond L | $123,000 | -- | |
| Reber Frederick J | $122,407 | -- | |
| Lauralex Homes Inc | $22,000 | -- |
Source: Public Records
Mortgage History
| Date | Status | Borrower | Loan Amount |
|---|---|---|---|
| Closed | Figary Raymond L | $52,500 | |
| Previous Owner | Reber Frederick J | $110,150 |
Source: Public Records
Tax History Compared to Growth
Tax History
| Year | Tax Paid | Tax Assessment Tax Assessment Total Assessment is a certain percentage of the fair market value that is determined by local assessors to be the total taxable value of land and additions on the property. | Land | Improvement |
|---|---|---|---|---|
| 2024 | $3,850 | $92,710 | $28,000 | $64,710 |
| 2023 | $3,247 | $70,245 | $12,915 | $57,330 |
| 2022 | $3,384 | $70,245 | $12,915 | $57,330 |
| 2021 | $3,198 | $70,245 | $12,915 | $57,330 |
| 2020 | $3,078 | $57,110 | $10,500 | $46,610 |
| 2019 | $3,093 | $57,110 | $10,500 | $46,610 |
| 2018 | $2,651 | $57,110 | $10,500 | $46,610 |
| 2017 | $2,657 | $51,363 | $9,982 | $41,381 |
| 2016 | $2,741 | $51,363 | $9,982 | $41,381 |
| 2015 | $2,761 | $51,363 | $9,982 | $41,381 |
| 2014 | $2,615 | $46,690 | $9,080 | $37,620 |
| 2013 | $2,515 | $54,020 | $10,500 | $43,520 |
Source: Public Records
Map
Nearby Homes
- 278 Ludlow Ct
- 243 Birmingham Ct
- 1644 Cantebury Ln
- 229 Dickens Ct
- 1130 Silversmith Way
- 1179 Silversmith Way
- 382 N Church Dr
- 1133 Reveres Run
- 364 Grey's Run
- 376 Grey's Run
- 351 Grey's Run
- 1443 N Broadway St
- 409 Bethpage Way Unit 7-301
- 5 Acres Ave
- 409 Bethpage Way
- 5 Acres Lot D Phillips Rd
- 1 Dryhill Ct
- 908 Hartz Dr
- 1112 Hubbell Ct
- 202 Charlotte Ave
- 1605 Cantebury Ln
- 1613 Cantebury Ln
- 265 Ludlow Ct
- 1617 Cantebury Ln
- 269 Ludlow Ct
- 262 Portland Blvd
- 270 Ludlow Ct
- 259 Beaulieu Ct
- 266 Portland Blvd
- 1614 Cantebury Ln
- 1621 Cantebury Ln
- 270 Portland Blvd
- 1618 Cantebury Ln
- 273 Ludlow Ct
- 255 Beaulieu Ct
- 1602 Cantebury Ln
- 274 Ludlow Ct
- 274 Portland Blvd
- 265 Birmingham Ct
- 1625 Cantebury Ln