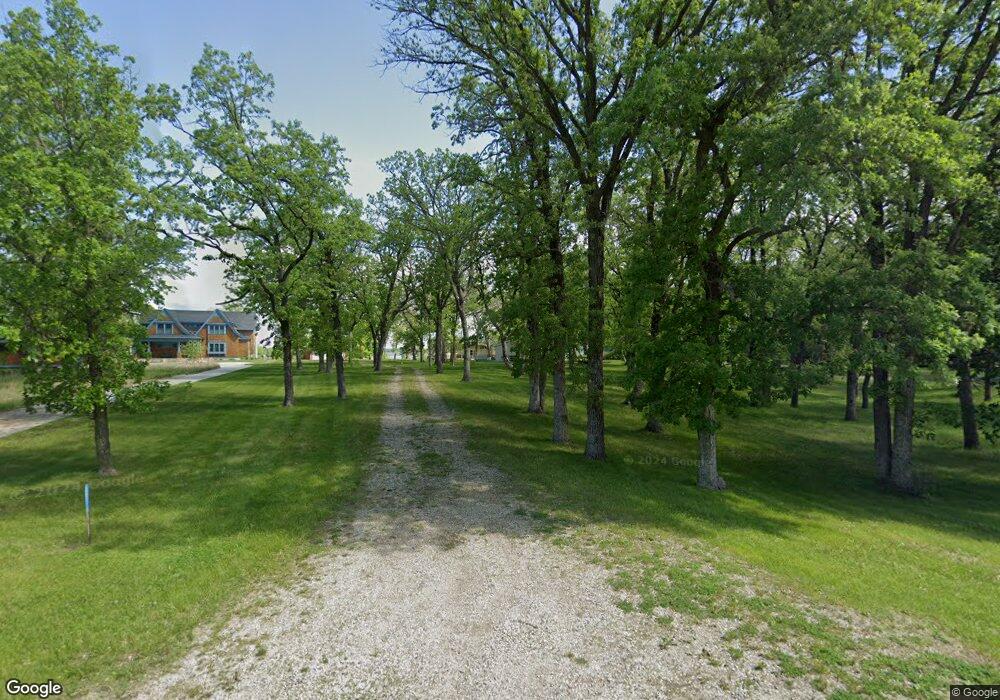
1609 S Le Hme Dieu Dr NE Unit NE Alexandria, MN 56308
Estimated Value: $512,000 - $860,815
4
Beds
2
Baths
966
Sq Ft
$747/Sq Ft
Est. Value
About This Home
This home is located at 1609 S Le Hme Dieu Dr NE Unit NE, Alexandria, MN 56308 and is currently estimated at $721,704, approximately $747 per square foot. 1609 S Le Hme Dieu Dr NE Unit NE is a home located in Douglas County with nearby schools including Voyager Elementary School, Discovery Middle School, and Alexandria Area High School.
Ownership History
Date
Name
Owned For
Owner Type
Purchase Details
Closed on
Apr 27, 2020
Sold by
Ferguson Jean Louise and Ferguson Ronald Timothy
Bought by
Swenson Brady C and Swenson Ashley R
Current Estimated Value
Home Financials for this Owner
Home Financials are based on the most recent Mortgage that was taken out on this home.
Original Mortgage
$420,727
Outstanding Balance
$372,822
Interest Rate
3.3%
Mortgage Type
New Conventional
Estimated Equity
$348,882
Purchase Details
Closed on
Aug 1, 2019
Sold by
Ferguson Jean Louise and Ferguson Ronald Timothy
Bought by
Swenson Brady and Swenson Ashley
Home Financials for this Owner
Home Financials are based on the most recent Mortgage that was taken out on this home.
Original Mortgage
$415,400
Interest Rate
3.8%
Mortgage Type
Land Contract Argmt. Of Sale
Purchase Details
Closed on
Dec 27, 2016
Sold by
Ferguson Jean Louise and Ferguson Ronald Timothy
Bought by
Ferguson Jean Louise
Create a Home Valuation Report for This Property
The Home Valuation Report is an in-depth analysis detailing your home's value as well as a comparison with similar homes in the area
Home Values in the Area
Average Home Value in this Area
Purchase History
| Date | Buyer | Sale Price | Title Company |
|---|---|---|---|
| Swenson Brady C | $467,000 | Integrity Title Inc | |
| Swenson Brady | $467,000 | None Available | |
| Ferguson Jean Louise | -- | Alexandria Title Co |
Source: Public Records
Mortgage History
| Date | Status | Borrower | Loan Amount |
|---|---|---|---|
| Open | Swenson Brady C | $420,727 | |
| Previous Owner | Swenson Brady | $415,400 |
Source: Public Records
Tax History Compared to Growth
Tax History
| Year | Tax Paid | Tax Assessment Tax Assessment Total Assessment is a certain percentage of the fair market value that is determined by local assessors to be the total taxable value of land and additions on the property. | Land | Improvement |
|---|---|---|---|---|
| 2025 | $8,806 | $831,600 | $494,200 | $337,400 |
| 2024 | $8,806 | $806,300 | $494,200 | $312,100 |
| 2023 | $8,320 | $729,600 | $443,000 | $286,600 |
| 2022 | $6,300 | $579,700 | $323,800 | $255,900 |
| 2021 | $6,080 | $511,500 | $281,200 | $230,300 |
| 2020 | $5,778 | $487,400 | $272,600 | $214,800 |
| 2019 | $5,664 | $449,000 | $243,200 | $205,800 |
| 2018 | $5,404 | $428,900 | $231,600 | $197,300 |
| 2017 | $5,176 | $408,500 | $231,600 | $176,900 |
| 2016 | $5,600 | $403,908 | $256,565 | $147,343 |
| 2015 | $5,742 | $0 | $0 | $0 |
| 2014 | -- | $444,100 | $290,500 | $153,600 |
Source: Public Records
Map
Nearby Homes
- TBD N Mckay Ave
- 2807 Government Point Rd NE
- 2501 Le Homme Dieu View NE
- 1801 Rachel Dr NE
- 1202 Ridgeview Terrace NE
- TBD Rachel Dr NE
- 2600 Le Homme Dieu View NE
- 2703 Le Homme Dieu View NE
- 2578 Cherry Lane Ct NE
- 3110 Van Ave NE Unit 1
- 2904 Le Homme Dieu View NE
- 2019 Fairway Ln NE
- 2503 S Le Homme Dieu Dr NE
- 1902 E Golf Course Rd NE Unit NE
- 1803 N Nokomis NE
- 1804 E Golf Course Rd NE Unit NE
- Lot 7 Northside Dr NE
- LOT 2 Northside Dr NE
- LOT 1 Northside Dr NE
- 7826 unit 9 County Road 42 NE
- 1609 S Le Hme Dieu Dr NE
- 1607 S Le Hme Dieu Dr NE Unit NE
- 1607 S Le Hme Dieu Dr NE
- 1611 S Le Hme Dieu Dr NE Unit NE
- 1605 S Le Homme Dieu Dr NE
- 1613 S Le Homme Dieu Dr NE Unit NE
- XXX S Le Homme Dieu Dr NE
- 1701 S Le Hme Dieu Dr NE Unit NE
- 1701 S Le Homme Dieu Dr NE
- 1603 S Le Hme Dieu Dr NE Unit NE
- 1603 S Le Hme Dieu Dr NE
- 1604 S Le Homme Dieu Dr NE
- 1608 S Le Hme Dieu Dr NE Unit NE
- 1606 S Le Hme Dieu Dr NE Unit NE
- 1521 S Le Homme Dieu Dr NE Unit NE
- 1521 S Le Homme Dieu Dr NE
- 1610 S Le Hme Dieu Dr NE Unit NE
- 1703 S Le Hme Dieu Dr NE Unit NE
- 1703 S Le Hme Dieu Dr NE
- 1604 S Le Hme Dieu Dr NE Unit NE