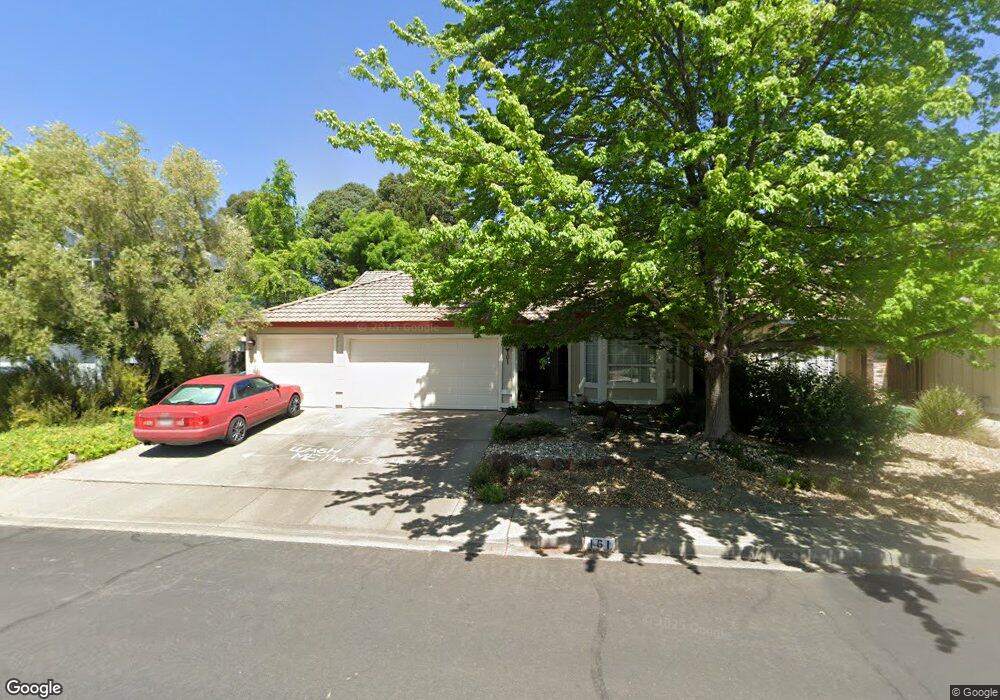
161 Lighthouse Way Vacaville, CA 95688
Estimated Value: $623,000 - $708,000
3
Beds
2
Baths
1,774
Sq Ft
$368/Sq Ft
Est. Value
About This Home
This home is located at 161 Lighthouse Way, Vacaville, CA 95688 and is currently estimated at $652,721, approximately $367 per square foot. 161 Lighthouse Way is a home located in Solano County with nearby schools including Browns Valley Elementary School, Willis Jepson Middle School, and Vacaville High School.
Ownership History
Date
Name
Owned For
Owner Type
Purchase Details
Closed on
Aug 28, 2015
Sold by
Gauthier David E and Gauthier Lori A
Bought by
Gauthier David E and Revoc Lori A Gauthier
Current Estimated Value
Purchase Details
Closed on
Oct 9, 2006
Sold by
Gauthier Lori Ann and Penn Lori Ann
Bought by
Gauthier David E and Gauthier Lori A
Home Financials for this Owner
Home Financials are based on the most recent Mortgage that was taken out on this home.
Original Mortgage
$150,000
Interest Rate
6.14%
Mortgage Type
Credit Line Revolving
Purchase Details
Closed on
Jan 31, 2000
Sold by
Klaren Darryl F and Klaren Marilyn R
Bought by
Penn Lori Ann
Home Financials for this Owner
Home Financials are based on the most recent Mortgage that was taken out on this home.
Original Mortgage
$180,000
Interest Rate
8.16%
Mortgage Type
Stand Alone First
Purchase Details
Closed on
Oct 25, 1993
Sold by
Valente George and Valente Lena E
Bought by
Saris Stephan D
Create a Home Valuation Report for This Property
The Home Valuation Report is an in-depth analysis detailing your home's value as well as a comparison with similar homes in the area
Home Values in the Area
Average Home Value in this Area
Purchase History
| Date | Buyer | Sale Price | Title Company |
|---|---|---|---|
| Gauthier David E | -- | None Available | |
| Gauthier David E | -- | Liberty Title Company | |
| Penn Lori Ann | $225,000 | Frontier Title Company | |
| Penn Lori Ann | -- | -- | |
| Saris Stephan D | -- | -- |
Source: Public Records
Mortgage History
| Date | Status | Borrower | Loan Amount |
|---|---|---|---|
| Closed | Gauthier David E | $150,000 | |
| Previous Owner | Penn Lori Ann | $180,000 |
Source: Public Records
Tax History Compared to Growth
Tax History
| Year | Tax Paid | Tax Assessment Tax Assessment Total Assessment is a certain percentage of the fair market value that is determined by local assessors to be the total taxable value of land and additions on the property. | Land | Improvement |
|---|---|---|---|---|
| 2025 | $4,122 | $345,810 | $76,844 | $268,966 |
| 2024 | $4,122 | $339,031 | $75,338 | $263,693 |
| 2023 | $4,036 | $332,384 | $73,861 | $258,523 |
| 2022 | $3,943 | $325,867 | $72,413 | $253,454 |
| 2021 | $3,934 | $319,479 | $70,994 | $248,485 |
| 2020 | $3,891 | $316,205 | $70,267 | $245,938 |
| 2019 | $3,833 | $310,006 | $68,890 | $241,116 |
| 2018 | $3,788 | $303,929 | $67,540 | $236,389 |
| 2017 | $3,650 | $297,970 | $66,216 | $231,754 |
| 2016 | $3,621 | $292,128 | $64,918 | $227,210 |
| 2015 | $3,576 | $287,741 | $63,943 | $223,798 |
| 2014 | $3,368 | $282,106 | $62,691 | $219,415 |
Source: Public Records
Map
Nearby Homes
- 107 Breakwater Way
- 1202 Villaggio Cir
- 536 Blarney Cir
- 524 Feather River Way
- 1012 Feather River Ct
- 330 Crow Canyon Ct
- 690 Elderberry Loop
- 685 Elderberry Loop
- 606 Roscommon Place
- 734 Shannon Dr
- 218 Donegal Ct
- 690 Hillcrest Cir
- 7056 Grace Feather Ct
- 101 Silver Eagle Way
- 830 Elderberry Loop
- 7115 Browns Valley Rd
- 245 Rolling Sage Cir
- 136 Pepperell Ct
- 6006 Peacock Ct
- 0 Seneca Ct
- 155 Lighthouse Way
- 167 Lighthouse Way
- 149 Lighthouse Way
- 173 Lighthouse Way
- 148 Lighthouse Way
- 154 Lighthouse Way
- 143 Lighthouse Way
- 142 Lighthouse Way
- 160 Lighthouse Way
- 136 Lighthouse Way
- 137 Lighthouse Way
- 200 Rice Ln
- 130 Lighthouse Way
- 155 Breakwater Way
- 149 Breakwater Way
- 143 Breakwater Way
- 161 Breakwater Way
- 131 Lighthouse Way
- 196 Breakwater Way
- 137 Breakwater Way