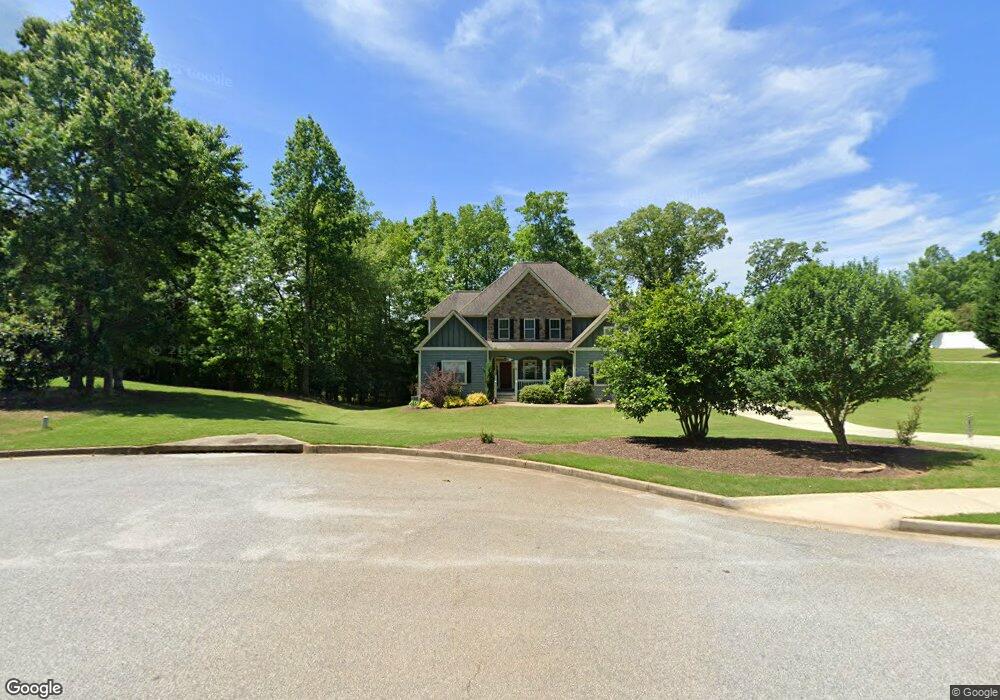
161 West Lake Pass Newnan, GA 30263
Estimated Value: $630,921 - $779,000
3
Beds
4
Baths
3,501
Sq Ft
$198/Sq Ft
Est. Value
About This Home
This home is located at 161 West Lake Pass, Newnan, GA 30263 and is currently estimated at $692,230, approximately $197 per square foot. 161 West Lake Pass is a home with nearby schools including Northside Elementary School, Madras Middle School, and Newnan High School.
Ownership History
Date
Name
Owned For
Owner Type
Purchase Details
Closed on
Feb 14, 2014
Sold by
Jeff Lindsey Communities I
Bought by
Groover Georgette D and Groover Kevin P
Current Estimated Value
Home Financials for this Owner
Home Financials are based on the most recent Mortgage that was taken out on this home.
Original Mortgage
$312,870
Outstanding Balance
$237,168
Interest Rate
4.42%
Mortgage Type
New Conventional
Estimated Equity
$455,062
Purchase Details
Closed on
Jul 10, 2013
Sold by
Ucb Lots Llc
Bought by
Jeff Lindsey Communities Llc
Purchase Details
Closed on
Apr 28, 2011
Sold by
United Community Bank
Bought by
Ucb Lots Llc
Purchase Details
Closed on
Oct 5, 2010
Sold by
Laureli Development Inc
Bought by
United Community Bank
Purchase Details
Closed on
Mar 29, 2006
Sold by
Milling Linda
Bought by
Laureli Development Inc
Purchase Details
Closed on
Sep 30, 1987
Bought by
Milling William E
Create a Home Valuation Report for This Property
The Home Valuation Report is an in-depth analysis detailing your home's value as well as a comparison with similar homes in the area
Home Values in the Area
Average Home Value in this Area
Purchase History
| Date | Buyer | Sale Price | Title Company |
|---|---|---|---|
| Groover Georgette D | $347,633 | -- | |
| Jeff Lindsey Communities Llc | $84,768 | -- | |
| Ucb Lots Llc | $16,300 | -- | |
| United Community Bank | $520,000 | -- | |
| Laureli Development Inc | $400,000 | -- | |
| Milling William E | -- | -- |
Source: Public Records
Mortgage History
| Date | Status | Borrower | Loan Amount |
|---|---|---|---|
| Open | Groover Georgette D | $312,870 |
Source: Public Records
Tax History Compared to Growth
Tax History
| Year | Tax Paid | Tax Assessment Tax Assessment Total Assessment is a certain percentage of the fair market value that is determined by local assessors to be the total taxable value of land and additions on the property. | Land | Improvement |
|---|---|---|---|---|
| 2024 | $5,883 | $258,010 | $28,000 | $230,010 |
| 2023 | $5,883 | $221,824 | $28,000 | $193,824 |
| 2022 | $4,724 | $196,459 | $22,000 | $174,459 |
| 2021 | $4,224 | $165,144 | $22,000 | $143,144 |
| 2020 | $4,252 | $165,144 | $22,000 | $143,144 |
| 2019 | $3,236 | $115,356 | $18,000 | $97,356 |
| 2018 | $3,242 | $115,356 | $18,000 | $97,356 |
| 2017 | $3,155 | $112,435 | $18,000 | $94,435 |
| 2016 | $3,120 | $112,435 | $18,000 | $94,435 |
| 2015 | $2,979 | $104,647 | $18,000 | $86,647 |
| 2014 | $297 | $63,604 | $18,000 | $45,604 |
Source: Public Records
Map
Nearby Homes
- 659 Country Club Rd
- 766 Country Club Rd
- 42 Club Cresswind Dr
- 34 Maggie Place
- 252 Happy Valley Cir
- 141 Green Park Way
- 86 Lancaster Way
- 8 Pine Ridge Dr
- 4 Golf Ln
- 237 Kory Dr
- 137 Alessie Dr
- 43 Warner Dr
- 78 Bedford Park Dr
- 156 N Square Ln
- 264 Baldwin Ct
- 264 Kendall St
- 19 Foster Dr
- 15 Cloverhurst Dr Unit LOT 15
- 367 Old Atlanta Hwy Unit LOT 4
- 371 Old Atlanta Hwy Unit LOT 5
- 173 West Lake Pass Unit 15
- 173 West Lake Pass
- 145 W Lake Pass
- 162 W Lake Pass Unit 13
- 162 W Lake Pass
- 162 West Lake Pass
- 170 West Lake Pass
- 170 West Lake Pass
- 148 West Lake Pass
- 153 W Lake Pass
- 153 W Lake Pass Unit 17
- 131 W Lake Pass
- 151 W Lake Pass
- 122 West Lake Pass Unit LOT 11
- 122 West Lake Pass
- 125 West Lake Pass
- 125 West Lake Pass Unit 21
- 125 West Lake Pass
- 103 West Lake Pass
- 106 West Lake Pass Unit LOT 10