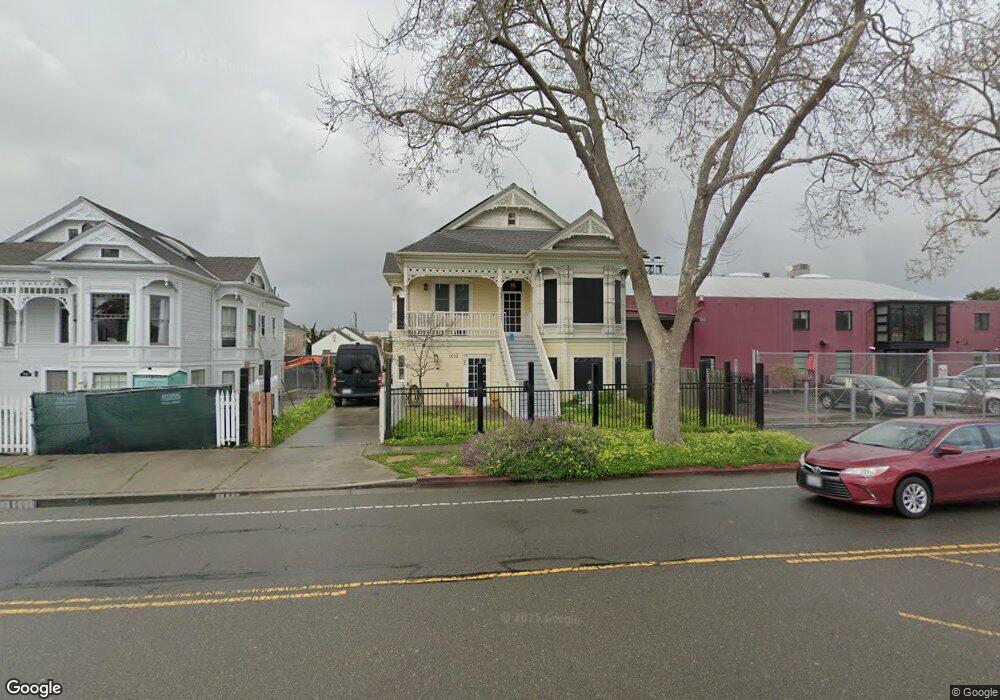
1610 6th St Berkeley, CA 94710
West Berkeley NeighborhoodEstimated Value: $871,000 - $1,566,065
6
Beds
3
Baths
2,866
Sq Ft
$406/Sq Ft
Est. Value
About This Home
This home is located at 1610 6th St, Berkeley, CA 94710 and is currently estimated at $1,162,266, approximately $405 per square foot. 1610 6th St is a home located in Alameda County with nearby schools including Rosa Parks Elementary School, Ruth Acty Elementary, and Berkeley Arts Magnet at Whittier School.
Create a Home Valuation Report for This Property
The Home Valuation Report is an in-depth analysis detailing your home's value as well as a comparison with similar homes in the area
Home Values in the Area
Average Home Value in this Area
Tax History
| Year | Tax Paid | Tax Assessment Tax Assessment Total Assessment is a certain percentage of the fair market value that is determined by local assessors to be the total taxable value of land and additions on the property. | Land | Improvement |
|---|---|---|---|---|
| 2025 | $9,262 | $225,746 | $119,295 | $281,749 |
| 2024 | $9,262 | $223,414 | $116,957 | $276,226 |
| 2023 | $7,269 | $385,475 | $114,664 | $270,811 |
| 2022 | $10,649 | $370,918 | $112,416 | $265,502 |
| 2021 | $10,613 | $363,509 | $110,212 | $260,297 |
| 2020 | $9,912 | $366,710 | $109,082 | $257,628 |
| 2019 | $9,348 | $359,521 | $106,944 | $252,577 |
| 2018 | $9,105 | $352,473 | $104,847 | $247,626 |
| 2017 | $8,770 | $345,563 | $102,792 | $242,771 |
| 2016 | $8,333 | $338,788 | $100,776 | $238,012 |
| 2015 | $8,175 | $333,700 | $99,263 | $234,437 |
| 2014 | $8,066 | $327,163 | $97,318 | $229,845 |
Source: Public Records
Map
Nearby Homes
- 817 Jones St
- 921 Jones St
- 935 Virginia St
- 1450 Fourth St Unit 5
- 998 Virginia St
- 817 Delaware St
- 1504 10th St
- 1623 10th St
- 0 Camelia St Unit 41104882
- 1609 Kains Ave
- 1406 San Pablo Ave Unit A
- 1128 Delaware St
- 1728 Curtis St
- 1050 Allston Way
- 1213 San Pablo Ave
- 1919 Curtis St
- 2220 7th St
- 1322 Virginia St
- 2238 7th St
- 1139 Cornell Ave
