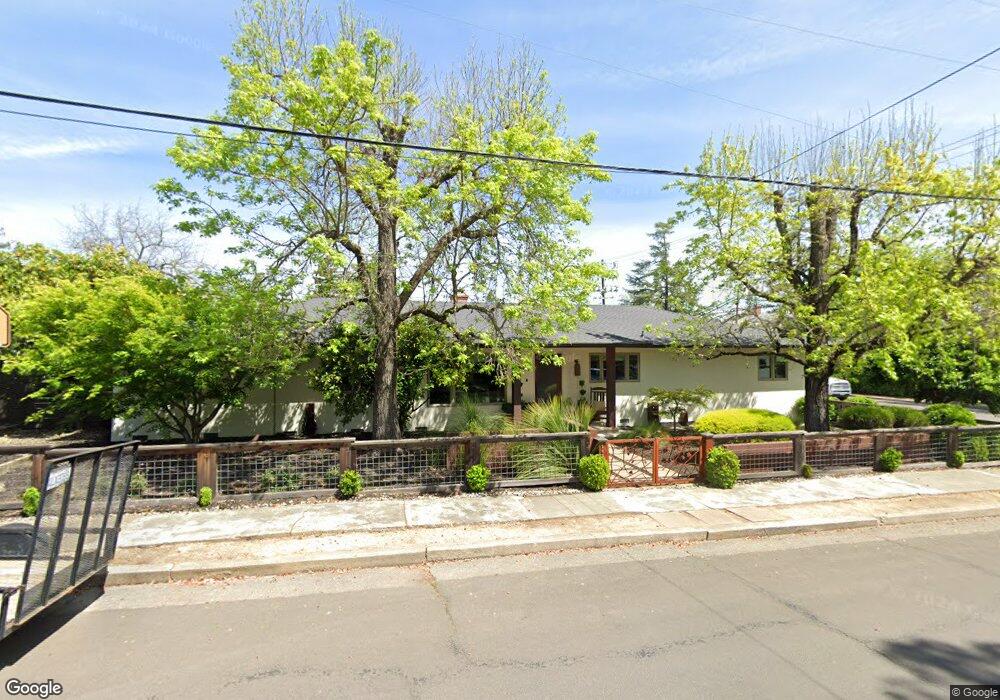
1610 Spring Mountain Rd Saint Helena, CA 94574
Estimated Value: $1,697,579 - $2,264,000
3
Beds
3
Baths
2,339
Sq Ft
$829/Sq Ft
Est. Value
About This Home
This home is located at 1610 Spring Mountain Rd, Saint Helena, CA 94574 and is currently estimated at $1,938,395, approximately $828 per square foot. 1610 Spring Mountain Rd is a home located in Napa County with nearby schools including Saint Helena Elementary School, Saint Helena Primary School, and Robert Louis Stevenson Intermediate School.
Ownership History
Date
Name
Owned For
Owner Type
Purchase Details
Closed on
Mar 30, 2017
Sold by
Smith Michael S and Smith Leah M
Bought by
Smith Michael S and Smith Leah M
Current Estimated Value
Purchase Details
Closed on
Oct 5, 2012
Sold by
Harrison H Stuart
Bought by
Smith Michael S and Smith Leah M
Home Financials for this Owner
Home Financials are based on the most recent Mortgage that was taken out on this home.
Original Mortgage
$749,000
Outstanding Balance
$517,053
Interest Rate
3.52%
Mortgage Type
Seller Take Back
Estimated Equity
$1,421,342
Purchase Details
Closed on
Mar 26, 1999
Sold by
Harrison Judith E
Bought by
Harrison H Stuart
Home Financials for this Owner
Home Financials are based on the most recent Mortgage that was taken out on this home.
Original Mortgage
$175,000
Interest Rate
6.79%
Create a Home Valuation Report for This Property
The Home Valuation Report is an in-depth analysis detailing your home's value as well as a comparison with similar homes in the area
Home Values in the Area
Average Home Value in this Area
Purchase History
| Date | Buyer | Sale Price | Title Company |
|---|---|---|---|
| Smith Michael S | -- | None Available | |
| Smith Michael S | $849,000 | First American Title Company | |
| Harrison H Stuart | -- | None Available | |
| Harrison H Stuart | -- | Napa Land Title Company |
Source: Public Records
Mortgage History
| Date | Status | Borrower | Loan Amount |
|---|---|---|---|
| Open | Smith Michael S | $749,000 | |
| Previous Owner | Harrison H Stuart | $175,000 |
Source: Public Records
Tax History
| Year | Tax Paid | Tax Assessment Tax Assessment Total Assessment is a certain percentage of the fair market value that is determined by local assessors to be the total taxable value of land and additions on the property. | Land | Improvement |
|---|---|---|---|---|
| 2025 | $11,171 | $1,052,682 | $554,138 | $498,544 |
| 2024 | $10,951 | $1,032,042 | $543,273 | $488,769 |
| 2023 | $10,951 | $1,011,807 | $532,621 | $479,186 |
| 2022 | $10,400 | $991,969 | $522,178 | $469,791 |
| 2021 | $10,262 | $972,520 | $511,940 | $460,580 |
| 2020 | $10,158 | $962,549 | $506,691 | $455,858 |
| 2019 | $9,981 | $943,676 | $496,756 | $446,920 |
| 2018 | $9,819 | $925,173 | $487,016 | $438,157 |
| 2017 | $9,634 | $907,033 | $477,467 | $429,566 |
| 2016 | $9,421 | $889,249 | $468,105 | $421,144 |
| 2015 | $9,348 | $875,893 | $461,074 | $414,819 |
| 2014 | $9,194 | $852,854 | $452,043 | $400,811 |
Source: Public Records
Map
Nearby Homes
- 1330 Pine St
- 1467 Kearney St
- 1651 Spring Mountain Rd
- 1317 Hillview Place
- 1430 Stockton St
- 1709 Spring Mountain Rd
- 1547 Allyn Ave
- 1830 Spring Mountain Rd
- 1841 Spring Mountain Rd
- 1503 Tainter St
- 1819 Spring Mountain Ct
- 1777 Adams St
- 1747 Scott St
- 1664 Spring St
- 1209 Stockton St
- 1711 Tainter St
- 1123 Oak Ave
- 1711 Spring St
- 1530 Voorhees Cir
- 921 Chiles Ave
- 1420 Madrona Ave
- 1620 Spring Mountain Rd
- 1607 Kearney St
- 1621 Kearney St
- 1644 Spring Mountain Rd
- 1605 Spring Mountain Rd
- 1543 Kearney St
- 1623 Spring Mountain Rd
- 1635 Kearney St
- 1443 Madrona Ave
- 1650 Spring Mountain Rd
- 1533 Kearney St
- 1637 Spring Mountain Rd
- 1649 Kearney St
- 1513 Madrona Ave
- 1610 Kearney St
- 1656 Spring Mountain Rd
- 1519 Kearney St
- 1659 Kearney St
Your Personal Tour Guide
Ask me questions while you tour the home.