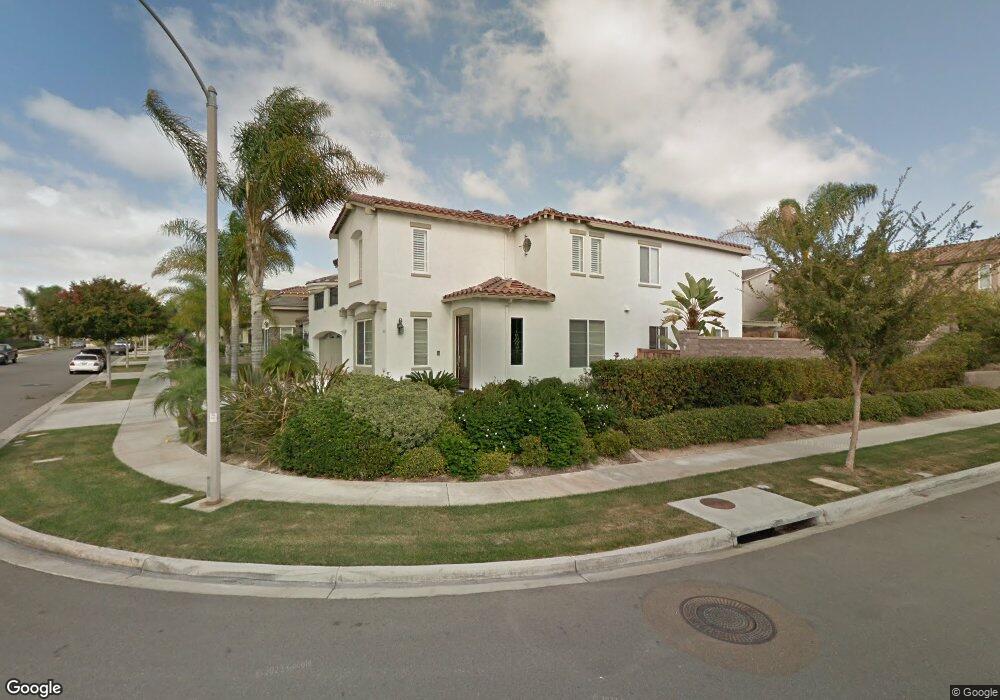
1611 Hillsborough St Chula Vista, CA 91913
Otay Ranch NeighborhoodEstimated Value: $1,253,000 - $1,391,000
6
Beds
4
Baths
3,565
Sq Ft
$369/Sq Ft
Est. Value
About This Home
This home is located at 1611 Hillsborough St, Chula Vista, CA 91913 and is currently estimated at $1,316,197, approximately $369 per square foot. 1611 Hillsborough St is a home located in San Diego County with nearby schools including Veterans Elementary School, Rancho Del Rey Middle School, and Olympian High School.
Ownership History
Date
Name
Owned For
Owner Type
Purchase Details
Closed on
Apr 16, 2008
Sold by
Rogers Jenalyn H
Bought by
Lu Yue K Chen and Ganyee Peizhen
Current Estimated Value
Home Financials for this Owner
Home Financials are based on the most recent Mortgage that was taken out on this home.
Original Mortgage
$417,000
Outstanding Balance
$266,075
Interest Rate
6.11%
Mortgage Type
Unknown
Estimated Equity
$1,050,122
Purchase Details
Closed on
Apr 27, 2007
Sold by
Keodara Vansavat and Keodara Jenalyn H
Bought by
Rogers Jenalyn H
Purchase Details
Closed on
Oct 20, 2004
Sold by
Otay Ranch R2a Llc
Bought by
Keodara Vansavat and Keodara Jenalyn H
Home Financials for this Owner
Home Financials are based on the most recent Mortgage that was taken out on this home.
Original Mortgage
$710,050
Interest Rate
1%
Mortgage Type
Negative Amortization
Create a Home Valuation Report for This Property
The Home Valuation Report is an in-depth analysis detailing your home's value as well as a comparison with similar homes in the area
Home Values in the Area
Average Home Value in this Area
Purchase History
| Date | Buyer | Sale Price | Title Company |
|---|---|---|---|
| Lu Yue K Chen | $660,000 | Fidelity National Title San | |
| Rogers Jenalyn H | -- | None Available | |
| Keodara Vansavat | $947,000 | Chicago Title Co |
Source: Public Records
Mortgage History
| Date | Status | Borrower | Loan Amount |
|---|---|---|---|
| Open | Lu Yue K Chen | $417,000 | |
| Previous Owner | Keodara Vansavat | $710,050 | |
| Closed | Keodara Vansavat | $142,000 |
Source: Public Records
Tax History Compared to Growth
Tax History
| Year | Tax Paid | Tax Assessment Tax Assessment Total Assessment is a certain percentage of the fair market value that is determined by local assessors to be the total taxable value of land and additions on the property. | Land | Improvement |
|---|---|---|---|---|
| 2025 | $14,968 | $866,889 | $367,770 | $499,119 |
| 2024 | $14,968 | $849,892 | $360,559 | $489,333 |
| 2023 | $14,965 | $833,229 | $353,490 | $479,739 |
| 2022 | $14,559 | $816,892 | $346,559 | $470,333 |
| 2021 | $14,208 | $800,875 | $339,764 | $461,111 |
| 2020 | $13,918 | $792,664 | $336,281 | $456,383 |
| 2019 | $13,604 | $777,123 | $329,688 | $447,435 |
| 2018 | $13,510 | $761,886 | $323,224 | $438,662 |
| 2017 | $13,271 | $746,948 | $316,887 | $430,061 |
| 2016 | $11,681 | $625,000 | $198,000 | $427,000 |
| 2015 | $11,229 | $600,000 | $191,000 | $409,000 |
| 2014 | $10,332 | $560,000 | $179,000 | $381,000 |
Source: Public Records
Map
Nearby Homes
- 1583 Mount Tamalpais Ave Unit 1
- 1676 Oconnor Ave
- 1679 Kincaid Ave
- 1682 May Ave
- 1518 Caminito Soria Unit 2
- 1566 Calle de La Flor Unit 2
- 1555 Tomillo Ln
- 1757 Barbour Ave
- 1622 Puffin Place Unit 3
- 1665 Santa Alexia Ave Unit 1
- 1423 Shearwater St Unit 1
- 1405 Santa Victoria Rd Unit 2
- 1474 Pershing Rd
- 2097 Bluestone Cir
- Residence 2 Plan at Corta Bella
- Residence 1 Plan at Corta Bella
- Residence 3 Plan at Corta Bella
- 1531 Santa Alexia Ave
- 1548 Hunters Glen Ave
- 1390 Santa Victoria Rd Unit 6
- 1607 Hillsborough St
- 1618 Tuscan Springs Ave
- 1614 Tuscan Springs Ave
- 1603 Hillsborough St
- 1610 Tuscan Springs Ave
- 1616 Hillsborough St
- 1620 Hillsborough St
- 1599 Hillsborough St Unit 226
- 1600 Hillsborough St
- 1604 Hillsborough St
- 1612 Hillsborough St
- 1606 Tuscan Springs Ave
- 1644 Orinda Ct Unit 2
- 1624 Hillsborough St
- 1608 Hillsborough St
- 1595 Hillsborough St
- 1628 Hillsborough St
- 1602 Tuscan Springs Ave
- 1640 Orinda Ct
- 1617 Tuscan Springs Ave