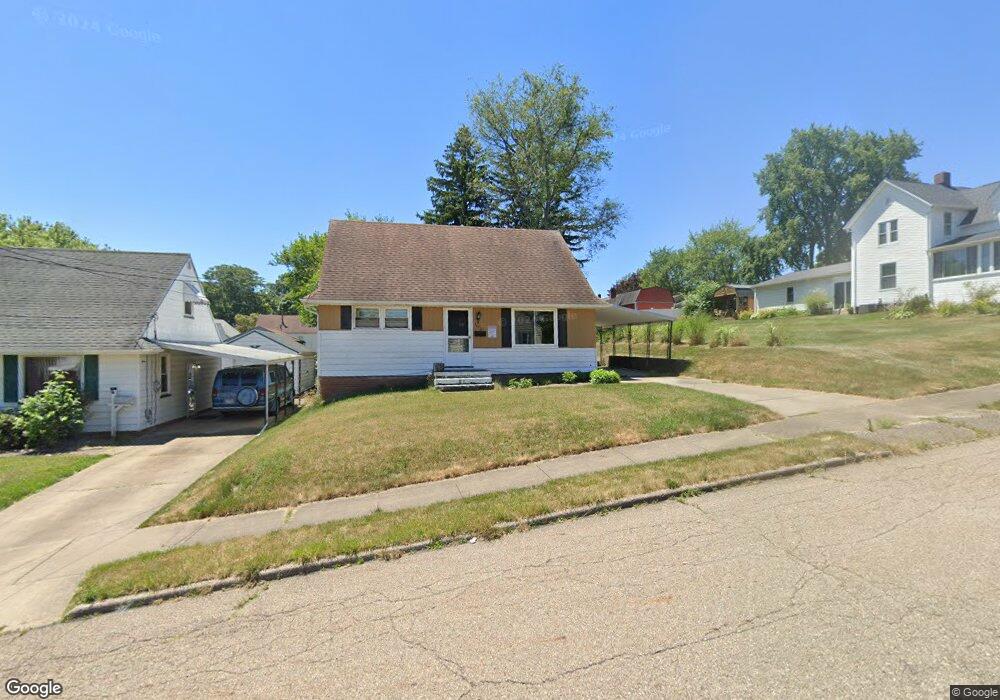
1612 Warrick Place NE Canton, OH 44714
Colonial Heights NeighborhoodEstimated Value: $104,000 - $127,029
3
Beds
1
Bath
1,248
Sq Ft
$93/Sq Ft
Est. Value
About This Home
This home is located at 1612 Warrick Place NE, Canton, OH 44714 and is currently estimated at $116,507, approximately $93 per square foot. 1612 Warrick Place NE is a home located in Stark County with nearby schools including Belle Stone Elementary School, Early Learning Center @ Schreiber, and Youtz Intermediate School.
Ownership History
Date
Name
Owned For
Owner Type
Purchase Details
Closed on
May 27, 2010
Sold by
Hsbc Bank Usa National Association
Bought by
Frost Terry L
Current Estimated Value
Purchase Details
Closed on
Jan 28, 2010
Sold by
Neil Manford A and Neil Karen V L
Bought by
Hsbc Bank Usa National Association
Purchase Details
Closed on
Jun 30, 2005
Sold by
Yablonski John M
Bought by
Neil Manford A and Neil Karen V L
Home Financials for this Owner
Home Financials are based on the most recent Mortgage that was taken out on this home.
Original Mortgage
$85,600
Interest Rate
6.5%
Mortgage Type
Fannie Mae Freddie Mac
Purchase Details
Closed on
Nov 17, 2004
Sold by
Yablonski John
Bought by
Yablonski John M
Purchase Details
Closed on
Jun 1, 2004
Sold by
Yablonski Rose M
Bought by
Yablonski John
Create a Home Valuation Report for This Property
The Home Valuation Report is an in-depth analysis detailing your home's value as well as a comparison with similar homes in the area
Home Values in the Area
Average Home Value in this Area
Purchase History
| Date | Buyer | Sale Price | Title Company |
|---|---|---|---|
| Frost Terry L | $30,500 | Accutitle Agency Inc | |
| Hsbc Bank Usa National Association | $52,000 | None Available | |
| Neil Manford A | $107,000 | -- | |
| Yablonski John M | -- | -- | |
| Yablonski John | -- | -- |
Source: Public Records
Mortgage History
| Date | Status | Borrower | Loan Amount |
|---|---|---|---|
| Previous Owner | Neil Manford A | $85,600 | |
| Closed | Neil Manford A | $21,400 |
Source: Public Records
Tax History Compared to Growth
Tax History
| Year | Tax Paid | Tax Assessment Tax Assessment Total Assessment is a certain percentage of the fair market value that is determined by local assessors to be the total taxable value of land and additions on the property. | Land | Improvement |
|---|---|---|---|---|
| 2025 | -- | $31,540 | $9,490 | $22,050 |
| 2024 | -- | $31,540 | $9,490 | $22,050 |
| 2023 | $1,196 | $29,160 | $7,700 | $21,460 |
| 2022 | $1,187 | $29,160 | $7,700 | $21,460 |
| 2021 | $1,199 | $29,160 | $7,700 | $21,460 |
| 2020 | $973 | $23,560 | $6,200 | $17,360 |
| 2019 | $850 | $23,570 | $6,200 | $17,370 |
| 2018 | $855 | $23,570 | $6,200 | $17,370 |
| 2017 | $747 | $20,520 | $5,850 | $14,670 |
| 2016 | $1,302 | $20,520 | $5,850 | $14,670 |
| 2015 | $1,310 | $20,520 | $5,850 | $14,670 |
| 2014 | $1,433 | $21,110 | $6,020 | $15,090 |
| 2013 | $690 | $21,110 | $6,020 | $15,090 |
Source: Public Records
Map
Nearby Homes
- 1638 Warrick Place NE
- 2510 Gross Ave NE
- 1321 Warrick Place NE
- 2310 Maple Ave NE
- 2315 Maple Ave NE
- 000 Rowland Ave NE
- 1233 29th St NE
- 1202 28th St NE
- 1306 Milford St NE
- 1220 25th St NE
- 1513 22nd St NE
- 1115 Colonial Blvd NE
- 2219 Rowland Ave NE
- 0 Dover Ave NE
- 2028 Saint Elmo Ave NE
- 2100 Maple Ave NE
- 1007 27th St NE
- 1607 20th St NE
- 0 Rowland Ave NE Unit 5089960
- 808 29th St NE
- 1616 Warrick Place NE
- 1600 Warrick Place NE
- 1626 Warrick Place NE
- 1626 Warrick Place NE
- 1615 Colonial Blvd NE
- 1611 Colonial Blvd NE
- 1619 Colonial Blvd NE
- 1607 Colonial Blvd NE
- 1623 Colonial Blvd NE
- 1611 Warrick Place NE
- 1603 Colonial Blvd NE
- 1630 Warrick Place NE
- 1607 Warrick Place NE
- 1623 Warrick Place NE
- 1627 Colonial Blvd NE
- 1603 Warrick Place NE
- 1528 Warrick Place NE
- 1634 Warrick Place NE
- 1627 Warrick Place NE
- 1629 Colonial Blvd NE