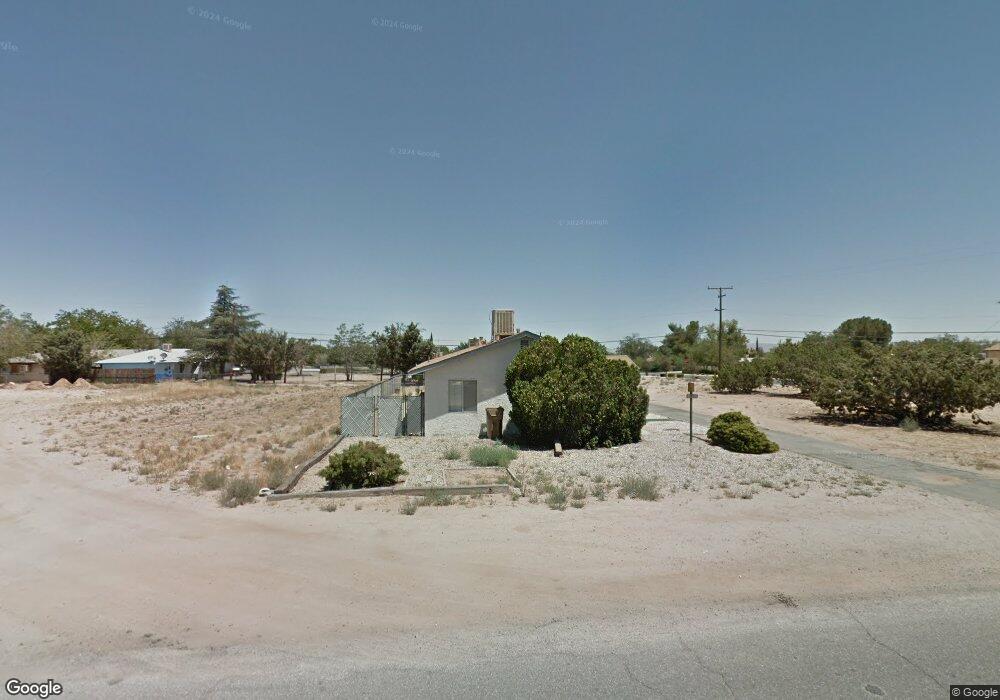
16120 Juniper St Hesperia, CA 92345
Downtown Hesperia NeighborhoodEstimated Value: $355,000 - $425,000
2
Beds
1
Bath
1,716
Sq Ft
$229/Sq Ft
Est. Value
About This Home
This home is located at 16120 Juniper St, Hesperia, CA 92345 and is currently estimated at $392,977, approximately $229 per square foot. 16120 Juniper St is a home located in San Bernardino County with nearby schools including Joshua Circle Elementary School, Hesperia Junior High School, and Hesperia High School.
Ownership History
Date
Name
Owned For
Owner Type
Purchase Details
Closed on
Dec 16, 2016
Sold by
Yee Gerald Frank and Yee Anne W
Bought by
Yee Gerald Frank and Yee Anne Woo
Current Estimated Value
Purchase Details
Closed on
Jan 21, 2016
Sold by
Abad Valerie and Robert Jones Living Trust
Bought by
Yee Gerald Frank and Yee Anne W
Home Financials for this Owner
Home Financials are based on the most recent Mortgage that was taken out on this home.
Original Mortgage
$117,000
Interest Rate
3.62%
Mortgage Type
New Conventional
Purchase Details
Closed on
Apr 19, 2007
Sold by
Jones Robert T
Bought by
Jones Robert and The Robert Jones Living Trust
Purchase Details
Closed on
Jun 30, 2000
Sold by
Hud
Bought by
Jones Robert T
Home Financials for this Owner
Home Financials are based on the most recent Mortgage that was taken out on this home.
Original Mortgage
$56,203
Interest Rate
8.12%
Mortgage Type
FHA
Purchase Details
Closed on
Jul 22, 1999
Sold by
Aurora Loan Services
Bought by
Hud
Create a Home Valuation Report for This Property
The Home Valuation Report is an in-depth analysis detailing your home's value as well as a comparison with similar homes in the area
Home Values in the Area
Average Home Value in this Area
Purchase History
| Date | Buyer | Sale Price | Title Company |
|---|---|---|---|
| Yee Gerald Frank | -- | None Available | |
| Yee Gerald Frank | $158,000 | Orange Coast Title Company | |
| Jones Robert | -- | None Available | |
| Jones Robert T | $40,500 | First American Title Co | |
| Hud | -- | Stewart Title | |
| Aurora Loan Services | $111,889 | Stewart Title |
Source: Public Records
Mortgage History
| Date | Status | Borrower | Loan Amount |
|---|---|---|---|
| Previous Owner | Yee Gerald Frank | $117,000 | |
| Previous Owner | Jones Robert T | $56,203 |
Source: Public Records
Tax History Compared to Growth
Tax History
| Year | Tax Paid | Tax Assessment Tax Assessment Total Assessment is a certain percentage of the fair market value that is determined by local assessors to be the total taxable value of land and additions on the property. | Land | Improvement |
|---|---|---|---|---|
| 2025 | $2,074 | $187,038 | $23,674 | $163,364 |
| 2024 | $2,074 | $183,371 | $23,210 | $160,161 |
| 2023 | $2,051 | $179,776 | $22,755 | $157,021 |
| 2022 | $2,005 | $176,251 | $22,309 | $153,942 |
| 2021 | $1,970 | $172,796 | $21,872 | $150,924 |
| 2020 | $1,947 | $171,024 | $21,648 | $149,376 |
| 2019 | $1,907 | $167,671 | $21,224 | $146,447 |
| 2018 | $1,872 | $164,383 | $20,808 | $143,575 |
| 2017 | $1,839 | $161,160 | $20,400 | $140,760 |
| 2016 | $780 | $63,645 | $11,458 | $52,187 |
| 2015 | -- | $62,689 | $11,286 | $51,403 |
| 2014 | $761 | $61,461 | $11,065 | $50,396 |
Source: Public Records
Map
Nearby Homes
- 16182 Spruce St
- 16050 Spruce St
- 9715 5th Ave
- 9754 5th Ave
- 2 Juniper St
- 16116 Cajon St
- 16245 Pine St
- 16396 Yucca St
- 16246 Pine St
- 16422 Spruce St
- 10 Live Oak St
- 19 Live Oak St
- 16366 Walnut St
- 16446 Yucca St
- 0 Live Oak St Unit HD25196848
- 0 Live Oak St Unit HD25086836
- 0 Live Oak St Unit HD24028838
- 15943 Pine St
- 5 Olive St
- 16443 Pine St
- 16135 Spruce St
- 16100 Juniper St
- 16119 Spruce St
- 16131 Juniper St
- 9566 5th Ave
- 16109 Spruce St Unit A
- 16109 Spruce St
- 16092 Juniper St
- 9565 5th Ave
- 16232 Juniper St
- 16099 Spruce St
- 16175 Spruce St
- 16082 Juniper St
- 16089 Juniper St
- 16165 Juniper St
- 16087 Spruce St
- 16176 Juniper St
- 9544 5th Ave
- 16140 Spruce St
- 16108 Yucca St