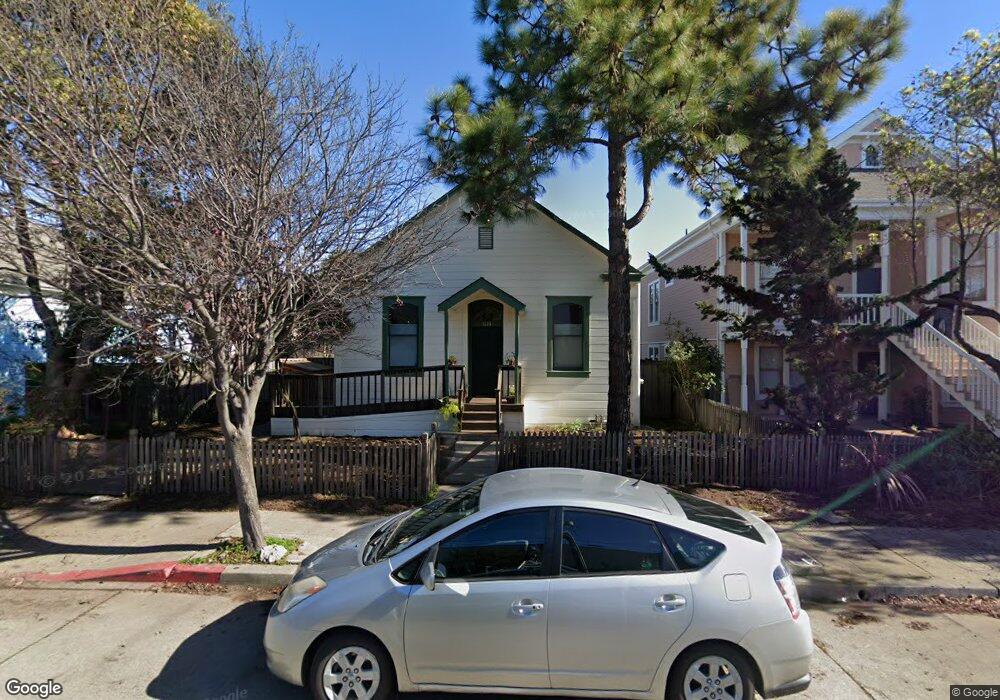
1613 5th St Berkeley, CA 94710
West Berkeley NeighborhoodEstimated Value: $1,100,518 - $1,313,000
2
Beds
1
Bath
980
Sq Ft
$1,247/Sq Ft
Est. Value
About This Home
This home is located at 1613 5th St, Berkeley, CA 94710 and is currently estimated at $1,222,380, approximately $1,247 per square foot. 1613 5th St is a home located in Alameda County with nearby schools including Rosa Parks Elementary School, Ruth Acty Elementary, and Berkeley Arts Magnet at Whittier School.
Ownership History
Date
Name
Owned For
Owner Type
Purchase Details
Closed on
Nov 10, 2020
Sold by
Patpatia Balbir S and Patpatia Diana S
Bought by
Gerber Daniel L and Patel Radhika
Current Estimated Value
Home Financials for this Owner
Home Financials are based on the most recent Mortgage that was taken out on this home.
Original Mortgage
$133,275
Outstanding Balance
$118,681
Interest Rate
2.84%
Mortgage Type
New Conventional
Estimated Equity
$1,103,699
Purchase Details
Closed on
Aug 14, 2017
Sold by
Sparling Alice Loyola and Estate Of Colman N Ahern
Bought by
Patpatia Balbir S and Patpatia Diana S
Purchase Details
Closed on
Feb 2, 2017
Sold by
Redevelopment Agency Of The City Of Berk
Bought by
Estate Of Colman Ahern
Purchase Details
Closed on
Oct 5, 2015
Sold by
The Berkeley Successor Agency To The For
Bought by
City Of Berkeley
Create a Home Valuation Report for This Property
The Home Valuation Report is an in-depth analysis detailing your home's value as well as a comparison with similar homes in the area
Home Values in the Area
Average Home Value in this Area
Purchase History
| Date | Buyer | Sale Price | Title Company |
|---|---|---|---|
| Gerber Daniel L | $1,144,000 | Fidelity National Title Co | |
| Patpatia Balbir S | $900,000 | Chicago Title Company | |
| Estate Of Colman Ahern | -- | None Available | |
| City Of Berkeley | -- | None Available |
Source: Public Records
Mortgage History
| Date | Status | Borrower | Loan Amount |
|---|---|---|---|
| Open | Gerber Daniel L | $133,275 | |
| Open | Gerber Daniel L | $765,600 |
Source: Public Records
Tax History
| Year | Tax Paid | Tax Assessment Tax Assessment Total Assessment is a certain percentage of the fair market value that is determined by local assessors to be the total taxable value of land and additions on the property. | Land | Improvement |
|---|---|---|---|---|
| 2025 | $17,578 | $1,231,287 | $371,486 | $866,801 |
| 2024 | $17,578 | $1,118,000 | $337,500 | $787,500 |
| 2023 | $17,182 | $1,190,217 | $357,065 | $833,152 |
| 2022 | $17,086 | $1,159,880 | $350,064 | $816,816 |
| 2021 | $17,829 | $1,137,000 | $343,200 | $800,800 |
| 2020 | $14,063 | $936,360 | $280,908 | $655,452 |
| 2019 | $13,688 | $918,000 | $275,400 | $642,600 |
| 2018 | $13,441 | $900,000 | $270,000 | $630,000 |
| 2017 | $11,976 | $800,000 | $500,000 | $300,000 |
| 2016 | $3,680 | $129,002 | $38,805 | $90,197 |
| 2015 | $3,606 | $127,065 | $38,222 | $88,843 |
| 2014 | $3,490 | $124,577 | $37,474 | $87,103 |
Source: Public Records
Map
Nearby Homes
- 817 Jones St
- 921 Jones St
- 1450 Fourth St Unit 5
- 817 Delaware St
- 995 Virginia St
- 940 Delaware St
- 0 Camelia St Unit 41104882
- 1128 Delaware St
- 2013 9th St
- 1339 Kains Ave
- 1728 Curtis St
- 1050 Allston Way
- 1400 Santa fe Ave
- 1631 Belvedere Ave
- 1213 San Pablo Ave
- 1234 Stannage Ave
- 1919 Curtis St
- 2220 7th St
- 1261 Hearst Ave
- 2238 7th St
Your Personal Tour Guide
Ask me questions while you tour the home.