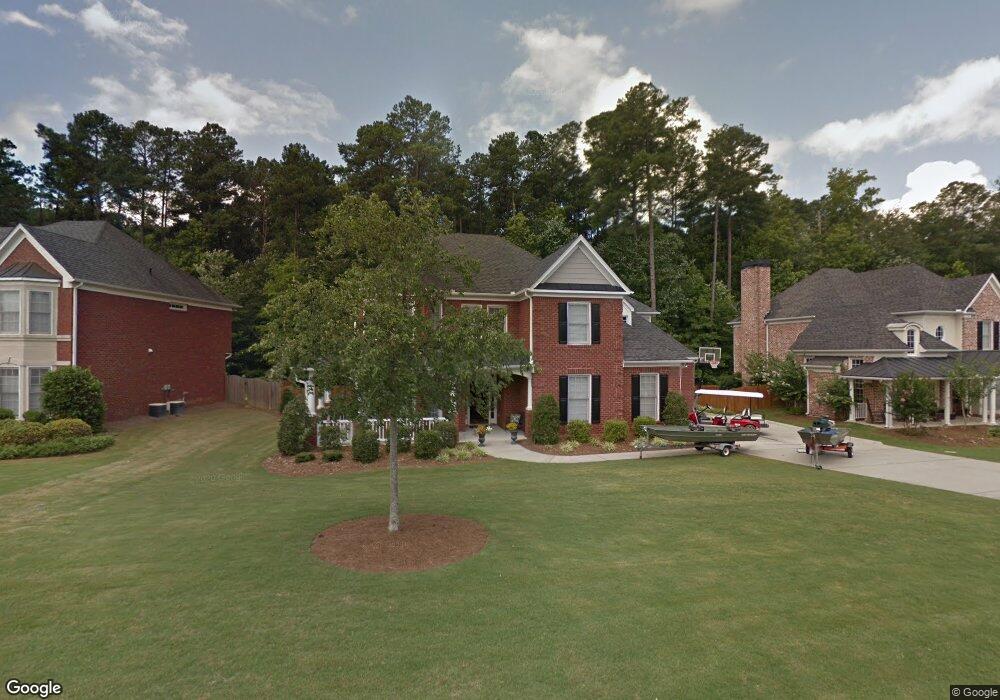
1613 Cascade Overlook Peachtree City, GA 30269
Estimated Value: $751,000 - $770,000
5
Beds
7
Baths
3,385
Sq Ft
$225/Sq Ft
Est. Value
About This Home
This home is located at 1613 Cascade Overlook, Peachtree City, GA 30269 and is currently estimated at $762,247, approximately $225 per square foot. 1613 Cascade Overlook is a home located in Fayette County with nearby schools including Peeples Elementary School, Rising Starr Middle School, and Starrs Mill High School.
Ownership History
Date
Name
Owned For
Owner Type
Purchase Details
Closed on
Jun 15, 2022
Sold by
Wagenknecht and Kimberly
Bought by
Parvate-Patil Girish and Rampure Pooja D
Current Estimated Value
Home Financials for this Owner
Home Financials are based on the most recent Mortgage that was taken out on this home.
Original Mortgage
$540,000
Outstanding Balance
$510,832
Interest Rate
4.63%
Mortgage Type
New Conventional
Estimated Equity
$251,415
Purchase Details
Closed on
Jul 29, 2019
Sold by
Davis Gary L
Bought by
Wagenknecht Richard and Wagenknecht Kimberly
Purchase Details
Closed on
Nov 21, 2003
Sold by
Centex Homes
Bought by
Davis Gary L and Davis Shelly
Home Financials for this Owner
Home Financials are based on the most recent Mortgage that was taken out on this home.
Original Mortgage
$54,989
Interest Rate
5.33%
Mortgage Type
New Conventional
Create a Home Valuation Report for This Property
The Home Valuation Report is an in-depth analysis detailing your home's value as well as a comparison with similar homes in the area
Home Values in the Area
Average Home Value in this Area
Purchase History
| Date | Buyer | Sale Price | Title Company |
|---|---|---|---|
| Parvate-Patil Girish | $675,000 | None Listed On Document | |
| Wagenknecht Richard | $467,500 | -- | |
| Davis Gary L | $366,600 | -- |
Source: Public Records
Mortgage History
| Date | Status | Borrower | Loan Amount |
|---|---|---|---|
| Open | Parvate-Patil Girish | $540,000 | |
| Previous Owner | Davis Gary L | $54,989 | |
| Previous Owner | Davis Gary L | $293,278 |
Source: Public Records
Tax History Compared to Growth
Tax History
| Year | Tax Paid | Tax Assessment Tax Assessment Total Assessment is a certain percentage of the fair market value that is determined by local assessors to be the total taxable value of land and additions on the property. | Land | Improvement |
|---|---|---|---|---|
| 2024 | $7,897 | $267,196 | $31,200 | $235,996 |
| 2023 | $6,874 | $226,600 | $31,200 | $195,400 |
| 2022 | $6,555 | $216,440 | $31,200 | $185,240 |
| 2021 | $5,693 | $185,320 | $31,200 | $154,120 |
| 2020 | $5,806 | $187,000 | $30,840 | $156,160 |
| 2019 | $5,650 | $180,200 | $31,200 | $149,000 |
| 2018 | $5,773 | $181,200 | $29,600 | $151,600 |
| 2017 | $5,804 | $180,960 | $29,600 | $151,360 |
| 2016 | $5,495 | $165,040 | $29,600 | $135,440 |
| 2015 | $5,339 | $157,720 | $22,800 | $134,920 |
| 2014 | $4,863 | $141,160 | $22,800 | $118,360 |
| 2013 | -- | $133,040 | $0 | $0 |
Source: Public Records
Map
Nearby Homes
- 418 Holly Brook Ln
- 105 Kraftwood Park
- 638 Grecken Green
- 190 Bontura Dr
- 155 W Creek Ct
- 211 Felspar Ridge
- 409 Holly Grove Church Rd
- 140 Bontura Dr
- 400 Mulberry Dr
- 135 Mulberry Dr
- 110 Cohabie Ct
- 555 Mountains Edge
- 300 Calebee Ave
- 345 Darien Dr
- 290 Calebee Ave
- 613 Preserve Place
- 608 Preserve Place
- 180 Brechin Dr
- 220 Calebee Ave
- 110 Tamerlane
- 1615 Cascade Overlook
- 1611 Cascade Overlook
- 0 Cascade Overlook Unit 8214782
- 0 Cascade Overlook Unit 7339348
- 0 Cascade Overlook Unit 7094932
- 0 Cascade Overlook Unit 7021162
- 0 Cascade Overlook Unit 8969575
- 0 Cascade Overlook Unit 8971252
- 0 Cascade Overlook Unit 9046214
- 0 Cascade Overlook Unit 3169597
- 0 Cascade Overlook Unit 3287533
- 0 Cascade Overlook
- 1617 Cascade Overlook
- 1609 Cascade Overlook
- 1614 Cascade Overlook
- 1610 Cascade Overlook
- 1616 Cascade Overlook
- 1607 Cascade Overlook
- 1306 Grand Prairie Chase
- 1608 Cascade Overlook