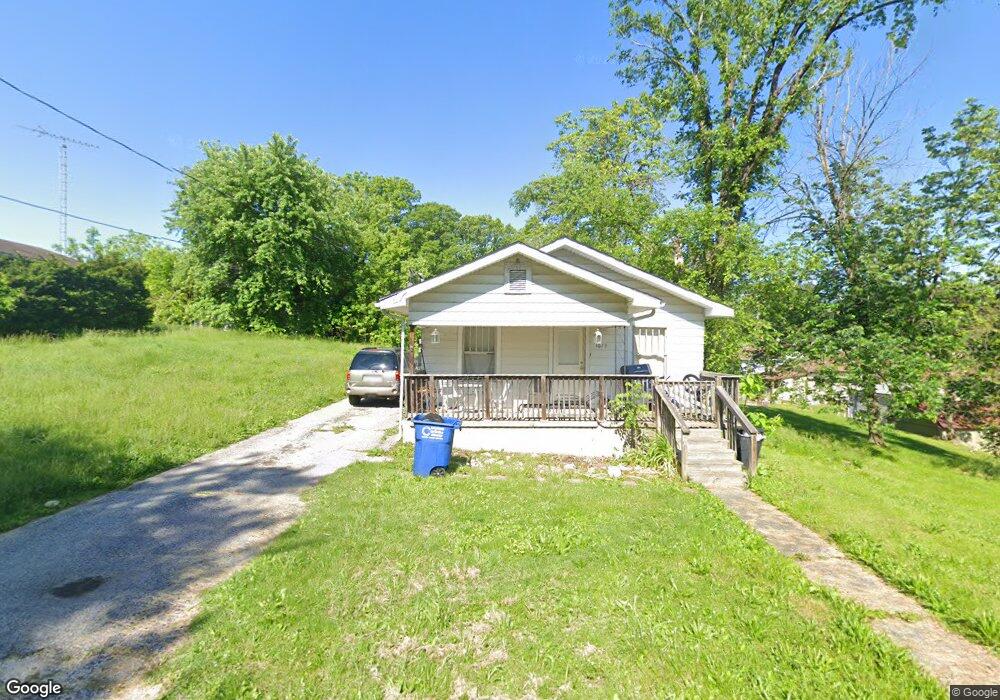
1613 D St Bedford, IN 47421
Estimated Value: $152,413 - $161,000
3
Beds
2
Baths
1,296
Sq Ft
$122/Sq Ft
Est. Value
About This Home
This home is located at 1613 D St, Bedford, IN 47421 and is currently estimated at $158,103, approximately $121 per square foot. 1613 D St is a home located in Lawrence County with nearby schools including Bedford North Lawrence High School, St. Vincent de Paul School, and Stone City Christian Academy.
Ownership History
Date
Name
Owned For
Owner Type
Purchase Details
Closed on
Sep 2, 2021
Sold by
Steeple Properties Llc
Bought by
Gibson Calvin and Gibson Sherry
Current Estimated Value
Purchase Details
Closed on
Jan 4, 2019
Sold by
Deckard Properties Llc
Bought by
Singh Kamaldeep
Purchase Details
Closed on
May 6, 2015
Sold by
Bryan K Bryan K and Roach Bridget E
Bought by
Deckard Properties Llc
Purchase Details
Closed on
May 5, 2015
Bought by
Roach Bryan K and Roach Bridget E
Purchase Details
Closed on
Apr 30, 2010
Sold by
Ranch Land Sales Of Arizona Llc
Bought by
Roach Bridget E and Roach Bryan K
Create a Home Valuation Report for This Property
The Home Valuation Report is an in-depth analysis detailing your home's value as well as a comparison with similar homes in the area
Home Values in the Area
Average Home Value in this Area
Purchase History
| Date | Buyer | Sale Price | Title Company |
|---|---|---|---|
| Gibson Calvin | -- | None Available | |
| Singh Kamaldeep | -- | -- | |
| Deckard Properties Llc | -- | -- | |
| Roach Bryan K | -- | -- | |
| Roach Bridget E | $40,000 | Ranch & Land Sales |
Source: Public Records
Tax History Compared to Growth
Tax History
| Year | Tax Paid | Tax Assessment Tax Assessment Total Assessment is a certain percentage of the fair market value that is determined by local assessors to be the total taxable value of land and additions on the property. | Land | Improvement |
|---|---|---|---|---|
| 2024 | $1,804 | $89,700 | $7,000 | $82,700 |
| 2023 | $1,673 | $83,100 | $6,800 | $76,300 |
| 2022 | $1,544 | $76,700 | $6,600 | $70,100 |
| 2021 | $1,379 | $68,500 | $6,400 | $62,100 |
| 2020 | $1,348 | $67,000 | $6,200 | $60,800 |
| 2019 | $1,301 | $64,600 | $5,900 | $58,700 |
| 2018 | $1,267 | $62,900 | $5,800 | $57,100 |
| 2017 | $1,217 | $60,400 | $5,700 | $54,700 |
| 2016 | $1,201 | $59,600 | $5,500 | $54,100 |
| 2014 | $424 | $61,500 | $5,500 | $56,000 |
| 2013 | -- | $60,000 | $5,500 | $54,500 |
Source: Public Records
Map
Nearby Homes