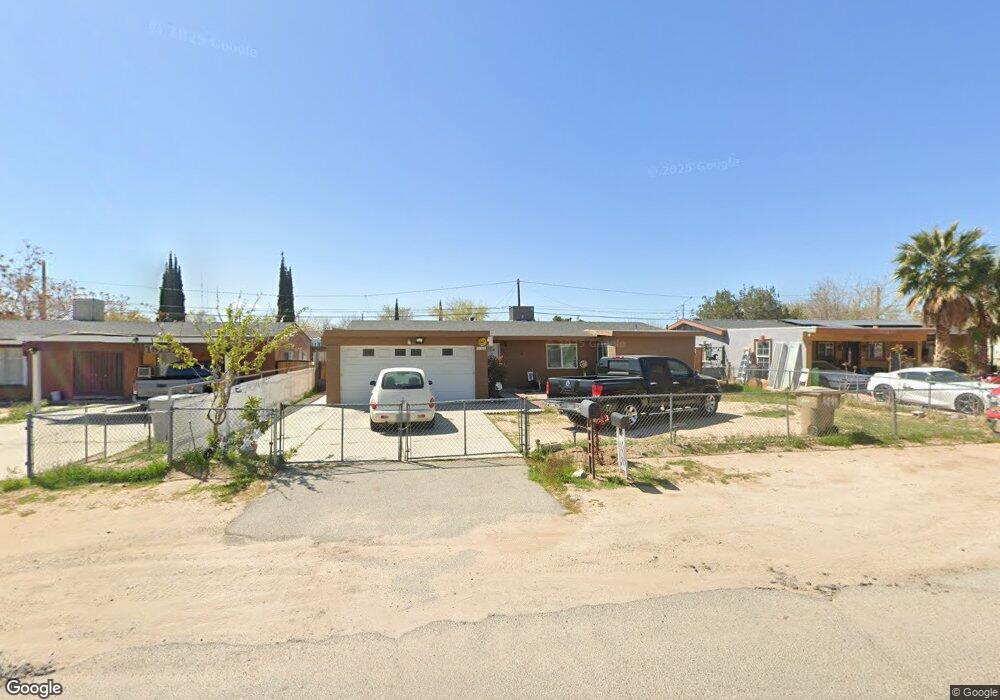
16141 Cajon St Hesperia, CA 92345
Downtown Hesperia NeighborhoodEstimated Value: $369,788 - $414,000
3
Beds
2
Baths
1,542
Sq Ft
$256/Sq Ft
Est. Value
About This Home
This home is located at 16141 Cajon St, Hesperia, CA 92345 and is currently estimated at $394,697, approximately $255 per square foot. 16141 Cajon St is a home located in San Bernardino County with nearby schools including Joshua Circle Elementary School, Hesperia Junior High School, and Hesperia High School.
Ownership History
Date
Name
Owned For
Owner Type
Purchase Details
Closed on
Aug 28, 2019
Sold by
Magallanes Amador and Magallanes Guillermina L
Bought by
Tlatenchi Cornelio
Current Estimated Value
Home Financials for this Owner
Home Financials are based on the most recent Mortgage that was taken out on this home.
Original Mortgage
$231,830
Outstanding Balance
$203,480
Interest Rate
3.7%
Mortgage Type
New Conventional
Estimated Equity
$191,217
Purchase Details
Closed on
Jul 22, 1994
Sold by
Hud
Bought by
Magallanes Amador and Magallanes Guillermina L
Home Financials for this Owner
Home Financials are based on the most recent Mortgage that was taken out on this home.
Original Mortgage
$46,012
Interest Rate
8.61%
Mortgage Type
FHA
Purchase Details
Closed on
Jan 4, 1994
Sold by
Barclaysamerican/Mtg Corp
Bought by
Hud
Purchase Details
Closed on
Dec 3, 1993
Sold by
Professional Foreclosure Corp
Bought by
Barclaysamerican/Mtg Corp
Create a Home Valuation Report for This Property
The Home Valuation Report is an in-depth analysis detailing your home's value as well as a comparison with similar homes in the area
Home Values in the Area
Average Home Value in this Area
Purchase History
| Date | Buyer | Sale Price | Title Company |
|---|---|---|---|
| Tlatenchi Cornelio | $239,000 | Wfg National Title Co Of Ca | |
| Magallanes Amador | $65,000 | Commonwealth Land Title Co | |
| Hud | -- | First Southwestern Title Co | |
| Barclaysamerican/Mtg Corp | $86,064 | First Southwestern Title Com |
Source: Public Records
Mortgage History
| Date | Status | Borrower | Loan Amount |
|---|---|---|---|
| Open | Tlatenchi Cornelio | $231,830 | |
| Previous Owner | Magallanes Amador | $46,012 |
Source: Public Records
Tax History
| Year | Tax Paid | Tax Assessment Tax Assessment Total Assessment is a certain percentage of the fair market value that is determined by local assessors to be the total taxable value of land and additions on the property. | Land | Improvement |
|---|---|---|---|---|
| 2025 | $2,932 | $261,382 | $52,276 | $209,106 |
| 2024 | $2,865 | $256,257 | $51,251 | $205,006 |
| 2023 | $2,834 | $251,232 | $50,246 | $200,986 |
| 2022 | $2,769 | $246,306 | $49,261 | $197,045 |
| 2021 | $2,719 | $241,476 | $48,295 | $193,181 |
| 2020 | $2,687 | $239,000 | $47,800 | $191,200 |
| 2019 | $878 | $73,894 | $18,414 | $55,480 |
| 2018 | $862 | $72,445 | $18,053 | $54,392 |
| 2017 | $848 | $71,024 | $17,699 | $53,325 |
| 2016 | $831 | $69,631 | $17,352 | $52,279 |
| 2015 | $821 | $68,585 | $17,091 | $51,494 |
| 2014 | $810 | $67,241 | $16,756 | $50,485 |
Source: Public Records
Map
Nearby Homes
- 16116 Cajon St
- 16150 Smoke Tree St
- 16129 Smoke Tree St
- 9678 5th Ave
- 16182 Spruce St
- 16300 Live Oak St
- 0 Live Oak St Unit HD25264449
- 0 Live Oak St Unit HD24028838
- 16362 Pine St
- 16043 Juniper St
- 16366 Live Oak St
- 16443 Pine St
- 16410 Spruce St
- 9788 9th Ave
- 16396 Yucca St
- 16533 Vine St
- 16503 Smoke Tree St
- 15813 Willow St
- 15823 Cashew St
- 0 E Hercules Ave Unit HD25256242
- 16151 Cajon St
- 16131 Cajon St
- 16161 Cajon St
- 16123 Cajon St
- 16132 Chestnut St
- 16142 Chestnut St
- 16128 Chestnut St
- 16171 Cajon St
- 16115 Cajon St
- 16118 Chestnut St
- 16152 Chestnut St
- 16148 Cajon St
- 16158 Cajon St
- 16138 Cajon St
- 16178 Cajon St
- 16168 Cajon St
- 16124 Cajon St
- 16108 Chestnut St
- 16160 Chestnut St
- 9776 5th Ave
Your Personal Tour Guide
Ask me questions while you tour the home.