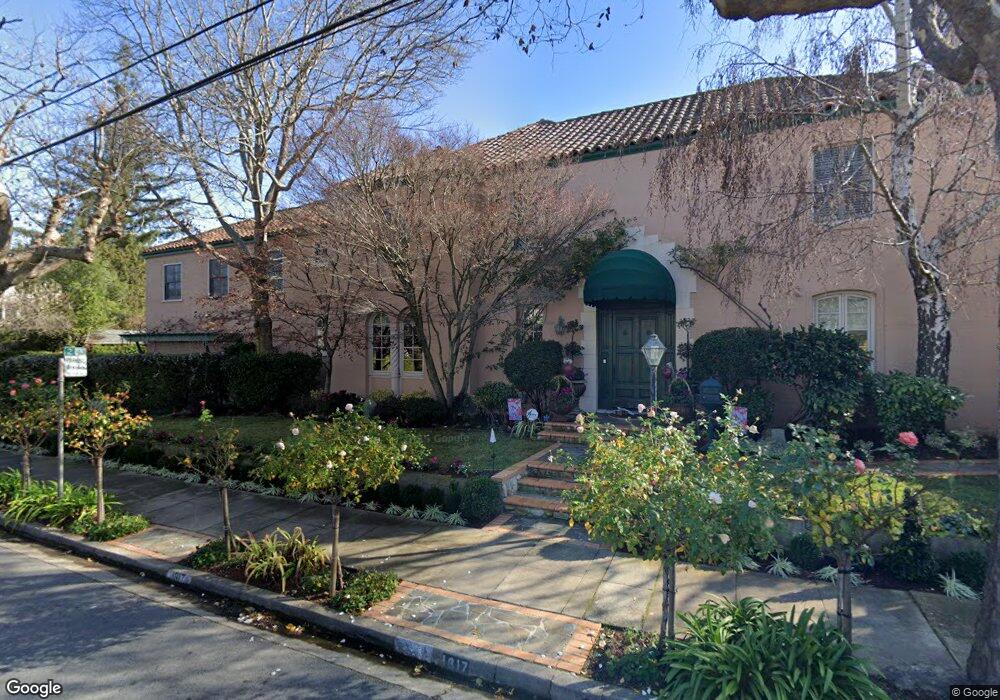
1617 Chapin Ave Burlingame, CA 94010
Burlingame Park NeighborhoodEstimated Value: $5,044,000 - $6,399,000
5
Beds
6
Baths
6,000
Sq Ft
$978/Sq Ft
Est. Value
About This Home
This home is located at 1617 Chapin Ave, Burlingame, CA 94010 and is currently estimated at $5,868,380, approximately $978 per square foot. 1617 Chapin Ave is a home located in San Mateo County with nearby schools including McKinley Elementary School, Burlingame Intermediate School, and Burlingame High School.
Ownership History
Date
Name
Owned For
Owner Type
Purchase Details
Closed on
Jul 26, 2022
Sold by
Debbie Bakhtiari
Bought by
Given Not
Current Estimated Value
Purchase Details
Closed on
Feb 25, 2011
Sold by
Bakhtiari Karl E and Bakhtiari Debora A
Bought by
Bakhtiari Debora Ann and Bakhtiari Karl Eric
Create a Home Valuation Report for This Property
The Home Valuation Report is an in-depth analysis detailing your home's value as well as a comparison with similar homes in the area
Home Values in the Area
Average Home Value in this Area
Purchase History
| Date | Buyer | Sale Price | Title Company |
|---|---|---|---|
| Given Not | -- | None Listed On Document | |
| Bakhtiari Debora Ann | -- | None Available |
Source: Public Records
Tax History Compared to Growth
Tax History
| Year | Tax Paid | Tax Assessment Tax Assessment Total Assessment is a certain percentage of the fair market value that is determined by local assessors to be the total taxable value of land and additions on the property. | Land | Improvement |
|---|---|---|---|---|
| 2025 | $30,910 | $3,087,028 | $1,102,498 | $1,984,530 |
| 2023 | $30,910 | $2,583,739 | $1,059,688 | $1,524,051 |
| 2022 | $27,542 | $2,409,549 | $1,038,910 | $1,370,639 |
| 2021 | $27,578 | $2,362,305 | $1,018,540 | $1,343,765 |
| 2020 | $27,002 | $2,338,085 | $1,008,097 | $1,329,988 |
| 2019 | $26,401 | $2,292,241 | $988,331 | $1,303,910 |
| 2018 | $25,896 | $2,247,296 | $968,952 | $1,278,344 |
| 2017 | $25,704 | $2,203,232 | $949,953 | $1,253,279 |
| 2016 | $25,435 | $2,160,033 | $931,327 | $1,228,706 |
| 2015 | $24,649 | $2,127,589 | $917,338 | $1,210,251 |
| 2014 | $24,289 | $2,085,914 | $899,369 | $1,186,545 |
Source: Public Records
Map
Nearby Homes
- 550 El Camino Real Unit 302
- 1515 Floribunda Ave Unit 309
- 1433 Floribunda Ave Unit 5
- 1433 Floribunda Ave Unit 7
- 1433 Floribunda Ave Unit 2
- 1433 Floribunda Ave Unit 1
- 1427 Floribunda Ave Unit 304
- 735 El Camino Real Unit 104
- 680 Fairway Cir
- 1133 Douglas Ave Unit 3
- 732 Paloma Ave
- 1121 Douglas Ave Unit 201
- 720 Brewer Dr
- 110 Park Rd Unit 103
- 715 Brewer Dr
- 215 Warren Rd
- 343 Warren Rd
- 670 Edgewood Rd
- 626 Occidental Ave
- 824 El Camino Real
- 328 Chapin Ln
- 324 Chapin Ln
- 341 Occidental Ave
- 329 Occidental Ave
- 400 Chapin Ln
- 325 Occidental Ave
- 320 Chapin Ln
- 1601 Chapin Ave
- 1616 Chapin Ave
- 401 Chapin Ln
- 333 Chapin Ln
- 321 Occidental Ave
- 325 Chapin Ln
- 316 Chapin Ln
- 1610 Chapin Ave
- 317 Occidental Ave
- 317 Chapin Ln
- 1604 Chapin Ave
- 313 Chapin Ln
- 315 Occidental Ave