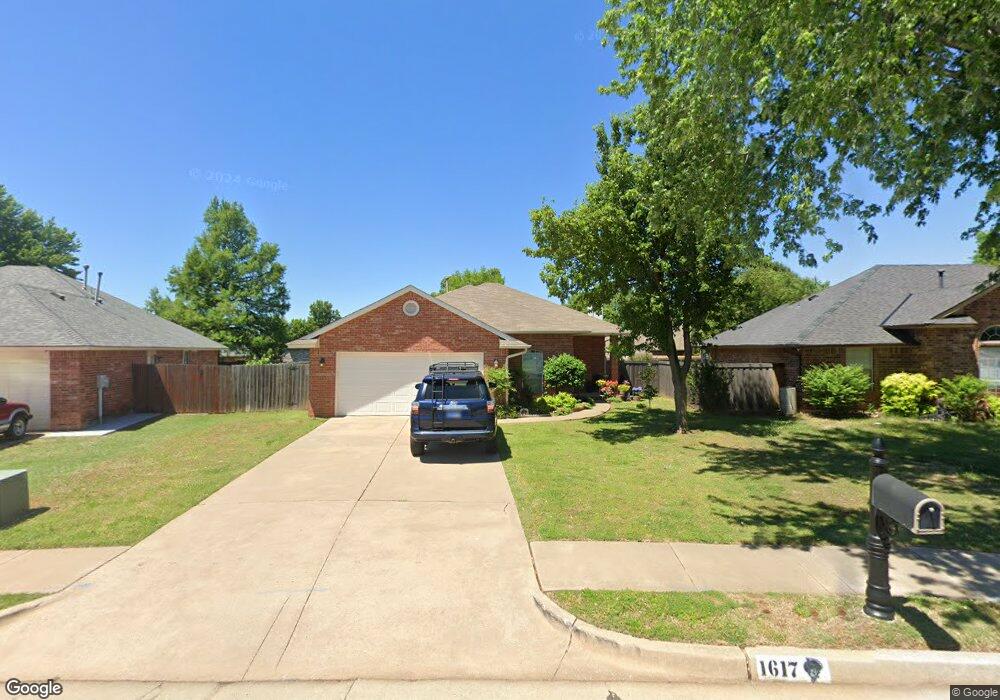
1617 George St Edmond, OK 73003
Pebble Creek NeighborhoodEstimated Value: $249,050 - $268,000
3
Beds
2
Baths
1,642
Sq Ft
$159/Sq Ft
Est. Value
About This Home
This home is located at 1617 George St, Edmond, OK 73003 and is currently estimated at $260,263, approximately $158 per square foot. 1617 George St is a home located in Oklahoma County with nearby schools including John Ross Elementary School, Cheyenne Middle School, and North High School.
Ownership History
Date
Name
Owned For
Owner Type
Purchase Details
Closed on
Jul 15, 2008
Sold by
Wells Travis W and Wells Debra A
Bought by
Wiewel Leslie
Current Estimated Value
Home Financials for this Owner
Home Financials are based on the most recent Mortgage that was taken out on this home.
Original Mortgage
$145,221
Outstanding Balance
$93,627
Interest Rate
6.4%
Mortgage Type
FHA
Estimated Equity
$166,636
Purchase Details
Closed on
Aug 26, 2002
Sold by
Wells Debra A and Wells Travis W
Bought by
Wells Travis and Wells Debra A
Purchase Details
Closed on
Jan 3, 2000
Sold by
Freeman Homes Inc
Bought by
Carl Debra A
Home Financials for this Owner
Home Financials are based on the most recent Mortgage that was taken out on this home.
Original Mortgage
$97,850
Interest Rate
7.75%
Purchase Details
Closed on
May 13, 1999
Sold by
Chateau Partners Llc
Bought by
Freeman Homes Inc
Create a Home Valuation Report for This Property
The Home Valuation Report is an in-depth analysis detailing your home's value as well as a comparison with similar homes in the area
Home Values in the Area
Average Home Value in this Area
Purchase History
| Date | Buyer | Sale Price | Title Company |
|---|---|---|---|
| Wiewel Leslie | $147,500 | Stewart Abstract & Title Of | |
| Wells Travis | -- | Oklahoma City Abstract & Tit | |
| Carl Debra A | $103,000 | -- | |
| Freeman Homes Inc | -- | -- |
Source: Public Records
Mortgage History
| Date | Status | Borrower | Loan Amount |
|---|---|---|---|
| Open | Wiewel Leslie | $145,221 | |
| Previous Owner | Carl Debra A | $97,850 |
Source: Public Records
Tax History
| Year | Tax Paid | Tax Assessment Tax Assessment Total Assessment is a certain percentage of the fair market value that is determined by local assessors to be the total taxable value of land and additions on the property. | Land | Improvement |
|---|---|---|---|---|
| 2025 | $2,381 | $23,799 | $3,374 | $20,425 |
| 2023 | $2,250 | $21,586 | $3,325 | $18,261 |
| 2022 | $2,151 | $20,559 | $3,681 | $16,878 |
| 2021 | $2,039 | $19,580 | $4,007 | $15,573 |
| 2020 | $2,018 | $19,140 | $3,834 | $15,306 |
| 2019 | $1,957 | $18,480 | $3,834 | $14,646 |
| 2018 | $1,875 | $17,600 | $0 | $0 |
| 2017 | $1,890 | $17,819 | $3,834 | $13,985 |
| 2016 | $1,886 | $17,819 | $3,187 | $14,632 |
| 2015 | $1,843 | $17,434 | $3,187 | $14,247 |
| 2014 | $1,767 | $16,733 | $3,187 | $13,546 |
Source: Public Records
Map
Nearby Homes
- 1508 George St
- 1813 Victoria Dr
- 1812 Dena Dr
- 1717 Park View Place
- 1801 Del Simmons Dr
- 2012 Cedar Meadow Ln
- 1909 Del Simmons Dr
- 1717 Rocky Mountain Way
- 1625 Deer Park Dr
- 2016 Kendal Ct
- 2324 Merlot Ct
- 813 Lapwing Rd
- 2425 Glenmere Dr
- 1300 Glenmere Ct
- 1433 Glenolde Place
- 713 Lapwing Rd
- 2101 N Kelly Ave
- 2316 Bradford Place
- 2725 Brenton Dr
- 2809 Sterling Dr
- 1613 George St
- 1621 George St
- 1704 Louis Scott St
- 1708 Louis Scott St
- 1625 George St
- 1712 Louis Scott St
- 1608 George St
- 1604 George St
- 1612 Louis Scott St
- 1617 Victoria Place
- 1605 George St
- 1716 Louis Scott St
- 1600 George St
- 1608 Louis Scott St
- 1601 Victoria Place
- 1601 George St
- 1516 George St
- 1705 Louis Scott St
- 1701 Louis Scott St
Your Personal Tour Guide
Ask me questions while you tour the home.