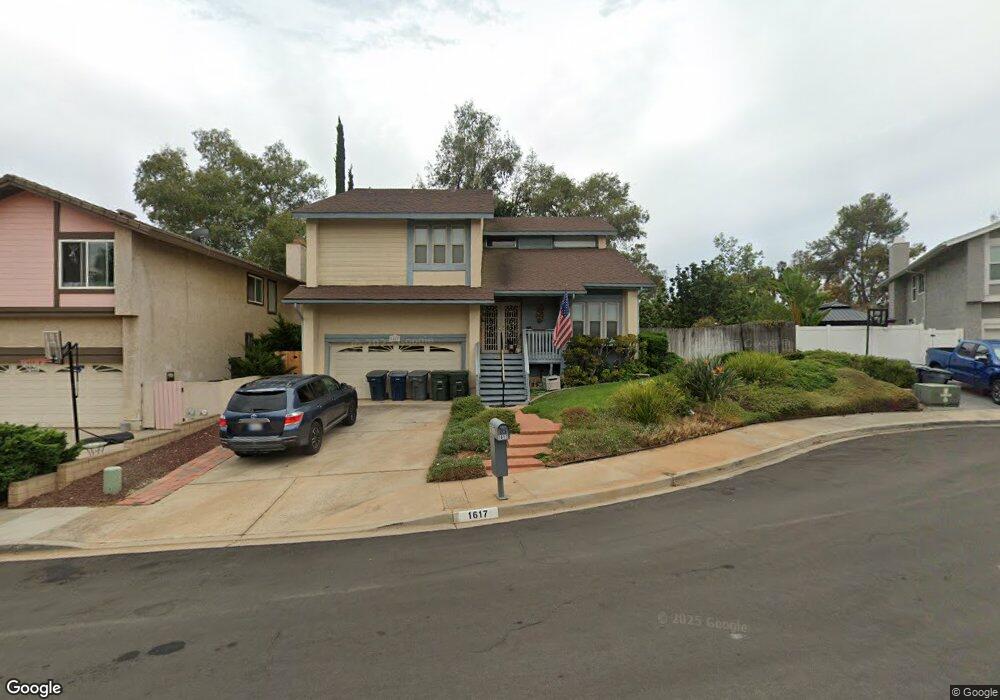
1617 Hawk Ridge Place Escondido, CA 92027
Midway NeighborhoodEstimated Value: $929,000 - $991,000
4
Beds
3
Baths
2,820
Sq Ft
$340/Sq Ft
Est. Value
About This Home
This home is located at 1617 Hawk Ridge Place, Escondido, CA 92027 and is currently estimated at $958,642, approximately $339 per square foot. 1617 Hawk Ridge Place is a home located in San Diego County with nearby schools including Oak Hill Elementary School, Hidden Valley Middle School, and Orange Glen High School.
Ownership History
Date
Name
Owned For
Owner Type
Purchase Details
Closed on
Sep 28, 2007
Sold by
Ohlsson Dennis B
Bought by
Ohlsson Donnette M
Current Estimated Value
Purchase Details
Closed on
Dec 14, 1998
Sold by
Cendant Mobility Services Inc
Bought by
Ohlsson Dennis B and Ohlsson Donnette M
Home Financials for this Owner
Home Financials are based on the most recent Mortgage that was taken out on this home.
Original Mortgage
$178,500
Interest Rate
6.98%
Purchase Details
Closed on
Oct 28, 1998
Sold by
Akira Ishihara
Bought by
Cendant Mobility Services Inc
Home Financials for this Owner
Home Financials are based on the most recent Mortgage that was taken out on this home.
Original Mortgage
$178,500
Interest Rate
6.98%
Purchase Details
Closed on
Dec 22, 1986
Create a Home Valuation Report for This Property
The Home Valuation Report is an in-depth analysis detailing your home's value as well as a comparison with similar homes in the area
Home Values in the Area
Average Home Value in this Area
Purchase History
| Date | Buyer | Sale Price | Title Company |
|---|---|---|---|
| Ohlsson Donnette M | -- | None Available | |
| Ohlsson Dennis B | $210,000 | First American Title | |
| Cendant Mobility Services Inc | $218,000 | First American Title | |
| -- | $156,300 | -- |
Source: Public Records
Mortgage History
| Date | Status | Borrower | Loan Amount |
|---|---|---|---|
| Previous Owner | Ohlsson Dennis B | $178,500 |
Source: Public Records
Tax History Compared to Growth
Tax History
| Year | Tax Paid | Tax Assessment Tax Assessment Total Assessment is a certain percentage of the fair market value that is determined by local assessors to be the total taxable value of land and additions on the property. | Land | Improvement |
|---|---|---|---|---|
| 2025 | $3,632 | $329,193 | $48,312 | $280,881 |
| 2024 | $3,632 | $322,739 | $47,365 | $275,374 |
| 2023 | $3,548 | $316,412 | $46,437 | $269,975 |
| 2022 | $3,509 | $310,209 | $45,527 | $264,682 |
| 2021 | $3,451 | $304,128 | $44,635 | $259,493 |
| 2020 | $3,430 | $301,011 | $44,178 | $256,833 |
| 2019 | $3,346 | $295,110 | $43,312 | $251,798 |
| 2018 | $3,252 | $289,324 | $42,463 | $246,861 |
| 2017 | $3,198 | $283,652 | $41,631 | $242,021 |
| 2016 | $3,135 | $278,091 | $40,815 | $237,276 |
| 2015 | $3,107 | $273,914 | $40,202 | $233,712 |
| 2014 | $2,978 | $268,549 | $39,415 | $229,134 |
Source: Public Records
Map
Nearby Homes
- 1427 Kingston Dr
- 623 Highland St
- 1811 E Grand Ave Unit 149
- 1817 E Grand Ave Unit 77
- 1817 E Grand Ave Unit 63
- 1817 E Grand Ave Unit 72
- 1811 E Grand Ave Unit 175
- 1817 E Grand Ave Unit 49
- 1817 E Grand Ave Unit 56
- 1811 E Grand Ave Unit 89
- 1380 Oak Hill Dr Unit 42
- 1380 Oak Hill Dr Unit 22
- 1380 Oak Hill Dr Unit 21
- 639 Judson St
- 1257 E Grand Ave Unit D
- 619 S Midway Dr
- 1322 Loma de Paz
- 2041 Ardath Ave
- 2041 E Grand Ave Unit 38
- 2041 E Grand Ave Unit 34
- 1623 Hawk Ridge Place
- 1611 Hawk Ridge Place
- 1629 Hawk Ridge Place
- 1605 Hawk Ridge Place
- 1624 Hawk Ridge Place
- 1640 Hawk Ridge Place
- 1616 Hawk Ridge Place
- 365 S Rose St
- 1610 Hawk Ridge Place
- 345 S Rose St
- 385 S Rose St
- 1635 Hawk Ridge Place
- 1648 Hawk Ridge Place
- 250 S Rose St
- 1641 Hawk Ridge Place
- 1647 Hawk Ridge Place
- 1654 Hawk Ridge Place
- 325 Rock Ridge Place
- 405 S Rose St
- 1560 Katella Way