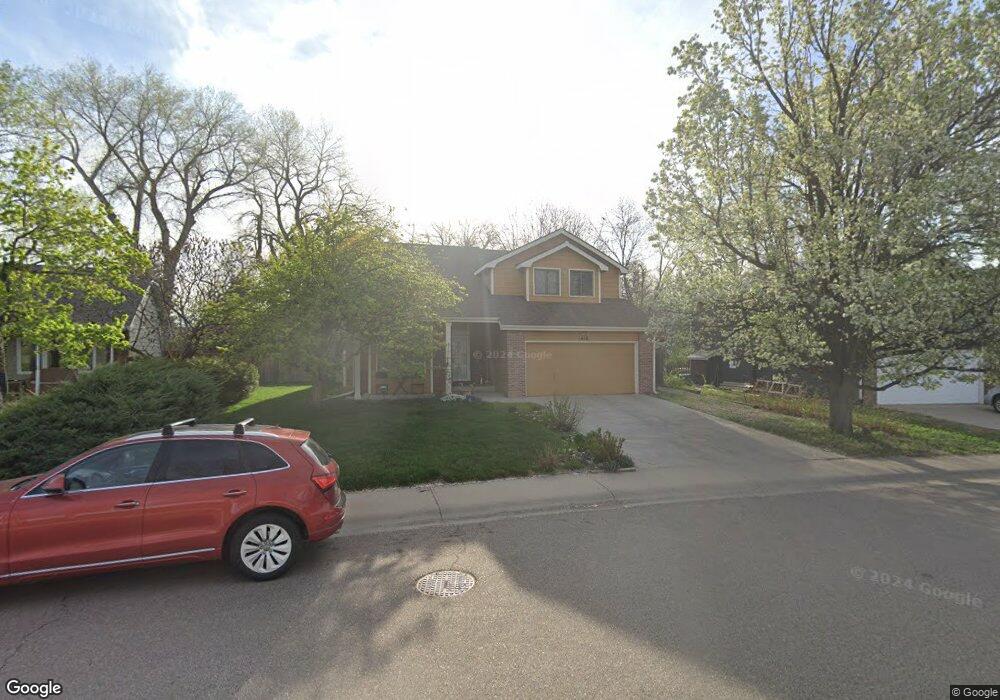
1618 Briarcliff Rd Fort Collins, CO 80524
Estimated Value: $665,000 - $741,000
5
Beds
4
Baths
3,320
Sq Ft
$214/Sq Ft
Est. Value
About This Home
This home is located at 1618 Briarcliff Rd, Fort Collins, CO 80524 and is currently estimated at $710,684, approximately $214 per square foot. 1618 Briarcliff Rd is a home located in Larimer County with nearby schools including Tavelli Elementary School, Lincoln Middle School, and Poudre High School.
Ownership History
Date
Name
Owned For
Owner Type
Purchase Details
Closed on
Jul 9, 2007
Sold by
Cox Nancy S
Bought by
Cox Nancy S and Wilmarth Jennifer K
Current Estimated Value
Home Financials for this Owner
Home Financials are based on the most recent Mortgage that was taken out on this home.
Original Mortgage
$233,600
Outstanding Balance
$145,320
Interest Rate
6.41%
Mortgage Type
Purchase Money Mortgage
Estimated Equity
$565,364
Purchase Details
Closed on
Jul 2, 2007
Sold by
Clay James Scott and Clay Lisa Karen
Bought by
Cox Nancy S
Home Financials for this Owner
Home Financials are based on the most recent Mortgage that was taken out on this home.
Original Mortgage
$233,600
Outstanding Balance
$145,320
Interest Rate
6.41%
Mortgage Type
Purchase Money Mortgage
Estimated Equity
$565,364
Purchase Details
Closed on
Aug 1, 1990
Bought by
Clay James Scott
Create a Home Valuation Report for This Property
The Home Valuation Report is an in-depth analysis detailing your home's value as well as a comparison with similar homes in the area
Home Values in the Area
Average Home Value in this Area
Purchase History
| Date | Buyer | Sale Price | Title Company |
|---|---|---|---|
| Cox Nancy S | -- | None Available | |
| Cox Nancy S | $292,000 | None Available | |
| Clay James Scott | $18,500 | -- |
Source: Public Records
Mortgage History
| Date | Status | Borrower | Loan Amount |
|---|---|---|---|
| Open | Cox Nancy S | $233,600 |
Source: Public Records
Tax History Compared to Growth
Tax History
| Year | Tax Paid | Tax Assessment Tax Assessment Total Assessment is a certain percentage of the fair market value that is determined by local assessors to be the total taxable value of land and additions on the property. | Land | Improvement |
|---|---|---|---|---|
| 2025 | $4,069 | $46,096 | $3,350 | $42,746 |
| 2024 | $3,872 | $46,096 | $3,350 | $42,746 |
| 2022 | $3,323 | $35,195 | $3,475 | $31,720 |
| 2021 | $3,358 | $36,208 | $3,575 | $32,633 |
| 2020 | $3,402 | $36,365 | $3,575 | $32,790 |
| 2019 | $3,417 | $36,365 | $3,575 | $32,790 |
| 2018 | $3,129 | $34,337 | $3,600 | $30,737 |
| 2017 | $3,119 | $34,337 | $3,600 | $30,737 |
| 2016 | $2,675 | $29,301 | $3,980 | $25,321 |
| 2015 | $2,656 | $29,300 | $3,980 | $25,320 |
| 2014 | $2,132 | $23,370 | $3,980 | $19,390 |
Source: Public Records
Map
Nearby Homes
- 1026 Linden Gate Ct
- 936 Bramblebush St
- 1013 E Willox Ln
- 0 Lorraine Dr
- 1812 Westview Rd
- 1300 Steeplechase Dr
- 1208 Miramont Dr
- 2115 Lindenmeier Rd
- 1412 Wimbledon Ct
- 2617 Treemont Dr
- 1328 Hillside Dr
- 1132 Country Club Rd
- 938 Schlagel St Unit 7
- 945 Abbott Ln Unit 4
- 827 Schlagel St Unit 3
- Sunlight Plan at Northfield at Old Town - Vista Collection
- Crestone Plan at Northfield at Old Town - Vista Collection
- Shavano Plan at Northfield at Old Town - Vista Collection
- Bierstadt Plan at Northfield at Old Town - Vista Collection
- Monarch Plan at Northfield at Old Town - Discovery
- 1612 Briarcliff Rd
- 1624 Briarcliff Rd
- 1606 Briarcliff Rd
- 1630 Briarcliff Rd
- 1600 Briarcliff Rd
- 1030 Bramblebush St
- 1649 Lindenmeier Rd
- 1512 Briarcliff Rd
- 1024 Bramblebush St
- 1506 Briarcliff Rd
- 1110 Lindenwood Dr
- 1018 Bramblebush St
- 1027 Linden Gate Ct
- 1030 Pica Run
- 1021 Linden Gate Ct
- 1115 Forest Hills Ln
- 1500 Briarcliff Rd
- 1012 Bramblebush St
- 1024 Pica Run
- 1015 Linden Gate Ct