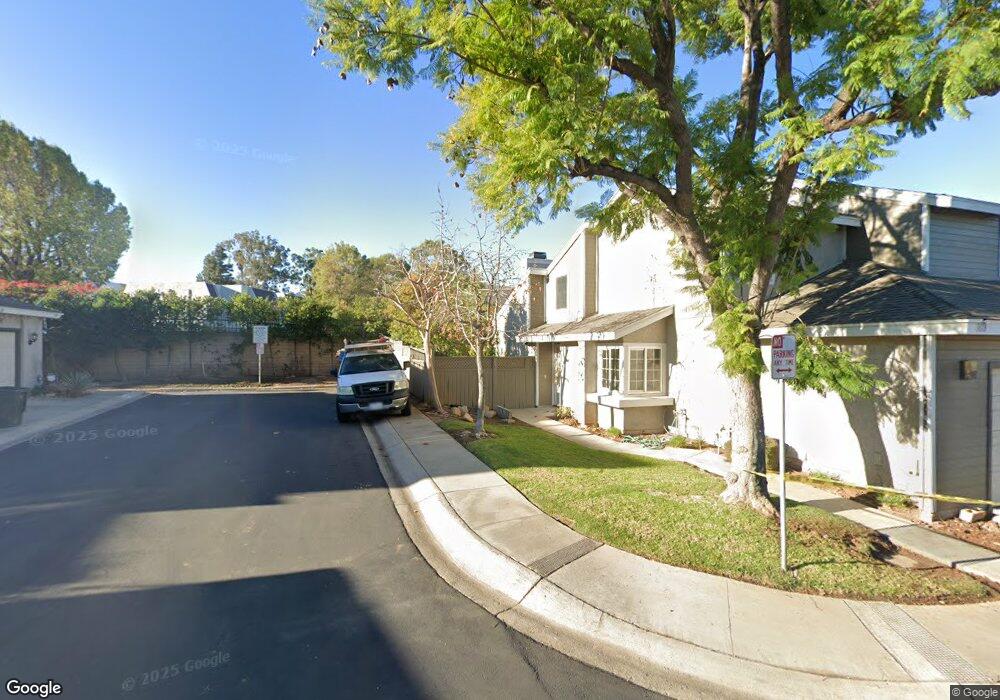
1618 Sumac Place Corona, CA 92882
Central Corona NeighborhoodEstimated Value: $567,763 - $604,000
3
Beds
2
Baths
1,497
Sq Ft
$392/Sq Ft
Est. Value
About This Home
This home is located at 1618 Sumac Place, Corona, CA 92882 and is currently estimated at $586,941, approximately $392 per square foot. 1618 Sumac Place is a home located in Riverside County with nearby schools including Coronita Elementary School, Letha Raney Intermediate School, and Corona High School.
Ownership History
Date
Name
Owned For
Owner Type
Purchase Details
Closed on
Jan 18, 2024
Sold by
Rogozinski Andrew J Revocable Trust
Bought by
Harpole Woodrow W Jr Revocable Trust and Harpole
Current Estimated Value
Purchase Details
Closed on
Jun 10, 2003
Sold by
Rogozinski Andrew J
Bought by
Rogozinski Andrew J and Andrew J Rogozinski Revocable Trust
Purchase Details
Closed on
Mar 19, 2003
Sold by
Rogozinski Andrew J
Bought by
Rogozinski Andrew J
Home Financials for this Owner
Home Financials are based on the most recent Mortgage that was taken out on this home.
Original Mortgage
$61,145
Interest Rate
5.78%
Mortgage Type
VA
Purchase Details
Closed on
Apr 24, 1995
Sold by
Rogozinski Andrew J
Bought by
Rogozinski Andrew J and The Andrew J Rogozinski Revocable Trust
Purchase Details
Closed on
May 2, 1994
Sold by
Rogozinski Marion J
Bought by
Rogozinski Andrew J
Create a Home Valuation Report for This Property
The Home Valuation Report is an in-depth analysis detailing your home's value as well as a comparison with similar homes in the area
Home Values in the Area
Average Home Value in this Area
Purchase History
| Date | Buyer | Sale Price | Title Company |
|---|---|---|---|
| Harpole Woodrow W Jr Revocable Trust | $325,000 | Stewart Title Guaranty Company | |
| Rogozinski Andrew J | -- | -- | |
| Rogozinski Andrew J | -- | American Title Co | |
| Rogozinski Andrew J | -- | -- | |
| Rogozinski Andrew J | -- | -- |
Source: Public Records
Mortgage History
| Date | Status | Borrower | Loan Amount |
|---|---|---|---|
| Previous Owner | Rogozinski Andrew J | $61,145 |
Source: Public Records
Tax History
| Year | Tax Paid | Tax Assessment Tax Assessment Total Assessment is a certain percentage of the fair market value that is determined by local assessors to be the total taxable value of land and additions on the property. | Land | Improvement |
|---|---|---|---|---|
| 2025 | $4,922 | $540,600 | $163,200 | $377,400 |
| 2023 | $4,922 | $170,557 | $39,800 | $130,757 |
| 2022 | $1,827 | $167,214 | $39,020 | $128,194 |
| 2021 | $1,790 | $163,936 | $38,255 | $125,681 |
| 2020 | $1,770 | $162,256 | $37,863 | $124,393 |
| 2019 | $1,728 | $159,075 | $37,121 | $121,954 |
| 2018 | $1,688 | $155,957 | $36,394 | $119,563 |
| 2017 | $1,646 | $152,900 | $35,681 | $117,219 |
| 2016 | $1,628 | $149,903 | $34,982 | $114,921 |
| 2015 | $1,592 | $147,653 | $34,457 | $113,196 |
| 2014 | $1,534 | $144,763 | $33,783 | $110,980 |
Source: Public Records
Map
Nearby Homes
- 1628 Sumac Place
- 1676 Sumac Place
- 1649 Toyon Place
- 834 Robles Place
- 1080 Sapphire Ln
- 856 Via Bernardo
- 1717 Via Del Rio
- 1194 Willits Dr
- 733 Via Felipe
- 1255 Jadestone Ln
- 848 Via Felipe
- 1421 Glengrove Square
- 1193 Miller Cir
- 1382 Via Santiago
- 1531 Camelot Dr
- 1420 Avenida Del Vista
- 1315 Via Santiago Unit A
- 1466 Camelot Dr
- 1307 Via Santiago Unit B
- 1422 Camelot Dr
- 1622 Sumac Place
- 1636 Sumac Place
- 889 Live Oak Place
- 895 Live Oak Place
- 885 Live Oak Place
- 876 Live Oak Place
- 881 Live Oak Place
- 1640 Sumac Place
- 881 Encino Place
- 872 Live Oak Place
- 877 Live Oak Place
- 875 Encino Place
- 1646 Sumac Place
- 873 Live Oak Place
- 868 Live Oak Place
- 867 Encino Place
- 862 Live Oak Place
- 869 Live Oak Place
- 1652 Sumac Place
- 863 Encino Place
Your Personal Tour Guide
Ask me questions while you tour the home.