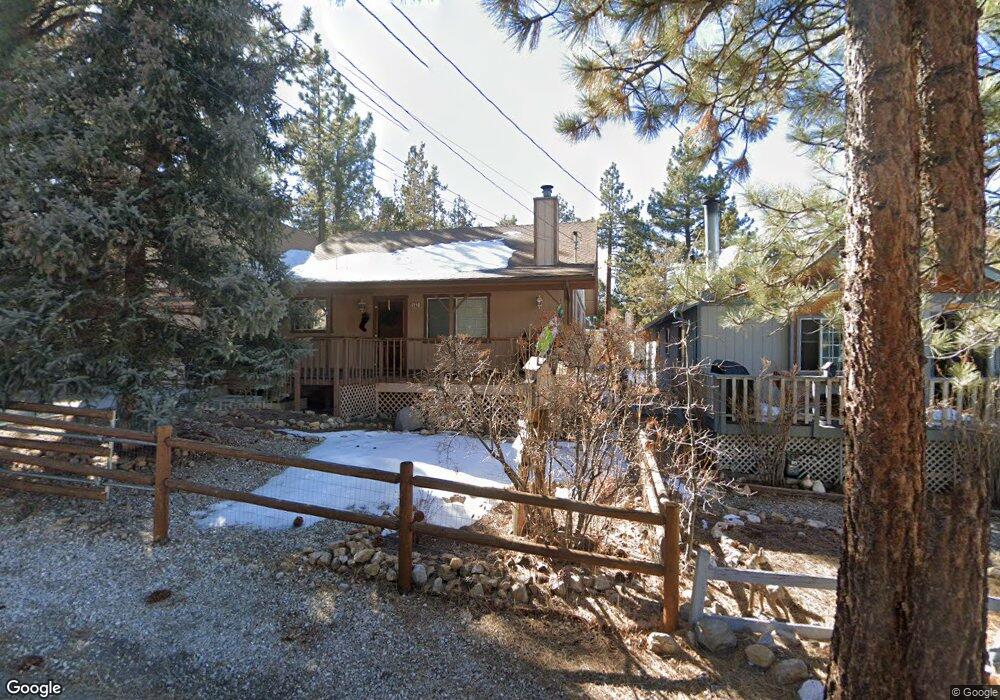
162 Spruce Ln Sugarloaf, CA 92386
Estimated Value: $321,000 - $359,000
2
Beds
2
Baths
1,080
Sq Ft
$314/Sq Ft
Est. Value
About This Home
This home is located at 162 Spruce Ln, Sugarloaf, CA 92386 and is currently estimated at $339,116, approximately $313 per square foot. 162 Spruce Ln is a home with nearby schools including Baldwin Lane Elementary School, Big Bear Middle School, and Big Bear High School.
Ownership History
Date
Name
Owned For
Owner Type
Purchase Details
Closed on
Jan 12, 2016
Sold by
Stackelhouse Sheldon J and Stackelhouse Gail M
Bought by
Stackelhouse Stuart J and Stackelhouse Minda E
Current Estimated Value
Home Financials for this Owner
Home Financials are based on the most recent Mortgage that was taken out on this home.
Original Mortgage
$185,000
Outstanding Balance
$146,942
Interest Rate
3.92%
Mortgage Type
Seller Take Back
Estimated Equity
$192,174
Purchase Details
Closed on
Mar 8, 2005
Sold by
Avilez Isidro and Avilez Esperanza
Bought by
Cann Gary Phillip and Cann Julie Anne
Home Financials for this Owner
Home Financials are based on the most recent Mortgage that was taken out on this home.
Original Mortgage
$168,000
Interest Rate
5.77%
Mortgage Type
Purchase Money Mortgage
Purchase Details
Closed on
Dec 13, 1999
Sold by
Stackelhouse Sheldon J
Bought by
Stackelhouse Sheldon J and Stackelhouse Gail M
Create a Home Valuation Report for This Property
The Home Valuation Report is an in-depth analysis detailing your home's value as well as a comparison with similar homes in the area
Home Values in the Area
Average Home Value in this Area
Purchase History
| Date | Buyer | Sale Price | Title Company |
|---|---|---|---|
| Stackelhouse Stuart J | $185,000 | Chicago Title Inland Empire | |
| Cann Gary Phillip | $210,000 | Fidelity National Title Co | |
| Stackelhouse Sheldon J | -- | -- |
Source: Public Records
Mortgage History
| Date | Status | Borrower | Loan Amount |
|---|---|---|---|
| Open | Stackelhouse Stuart J | $185,000 | |
| Closed | Cann Gary Phillip | $168,000 | |
| Closed | Cann Gary Phillip | $31,500 |
Source: Public Records
Tax History
| Year | Tax Paid | Tax Assessment Tax Assessment Total Assessment is a certain percentage of the fair market value that is determined by local assessors to be the total taxable value of land and additions on the property. | Land | Improvement |
|---|---|---|---|---|
| 2025 | $3,685 | $219,001 | $35,513 | $183,488 |
| 2024 | $3,522 | $214,707 | $34,817 | $179,890 |
| 2023 | $3,417 | $210,497 | $34,134 | $176,363 |
| 2022 | $3,291 | $206,370 | $33,465 | $172,905 |
| 2021 | $3,220 | $202,324 | $32,809 | $169,515 |
| 2020 | $3,228 | $200,250 | $32,473 | $167,777 |
| 2019 | $3,150 | $196,323 | $31,836 | $164,487 |
| 2018 | $3,033 | $192,474 | $31,212 | $161,262 |
| 2017 | $2,951 | $188,700 | $30,600 | $158,100 |
| 2016 | $2,155 | $117,162 | $26,362 | $90,800 |
| 2015 | $2,117 | $115,402 | $25,966 | $89,436 |
| 2014 | $2,074 | $113,141 | $25,457 | $87,684 |
Source: Public Records
Map
Nearby Homes
- 249 Cedar Ln
- 265 Cedar Ln
- 114 Cedar Ln
- 267 Spruce Ln
- 259 Victoria Ln
- 270 Maple Ln
- 189 Moreno Ln
- 183 Moreno Ln
- 48268 Curvate Baldwin Ln
- 298 Maple Ln
- 317 Spruce Ln
- 332 Cedar Ln
- 314 Victoria Ln
- 140 Highland Ln
- 390 Spruce Ln
- 304 Highland Ln
- 1039 Heritage Trail
- 271 Leonard Ln
- 417 Spruce Ln
- 216 Leonard Ln
Your Personal Tour Guide
Ask me questions while you tour the home.