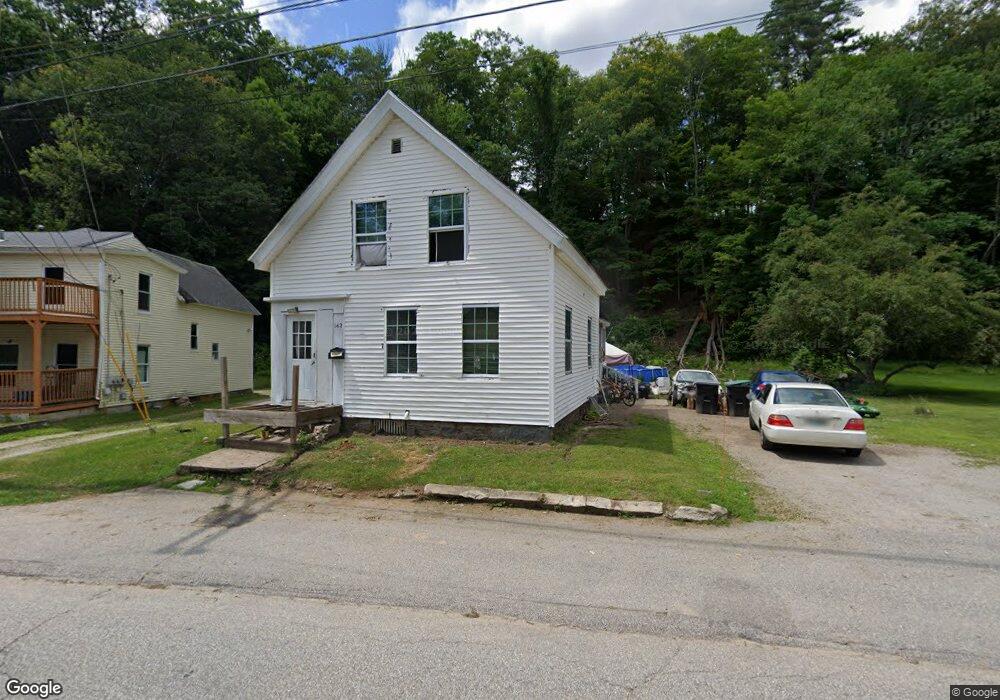
162 W Bow St Franklin, NH 03235
Estimated Value: $268,000 - $341,000
3
Beds
2
Baths
1,479
Sq Ft
$210/Sq Ft
Est. Value
About This Home
This home is located at 162 W Bow St, Franklin, NH 03235 and is currently estimated at $310,348, approximately $209 per square foot. 162 W Bow St is a home located in Merrimack County with nearby schools including Paul A. Smith School, Franklin Middle School, and Franklin High School.
Ownership History
Date
Name
Owned For
Owner Type
Purchase Details
Closed on
Aug 21, 2024
Sold by
Franklin City Of
Bought by
May William
Current Estimated Value
Purchase Details
Closed on
Jul 19, 2023
Sold by
Franklin City Of
Bought by
May William
Purchase Details
Closed on
Jan 6, 2022
Sold by
May Lori C
Bought by
May William
Purchase Details
Closed on
Sep 19, 2016
Sold by
Gilbette Pouliot Ft and Laplante
Bought by
May Lori C
Create a Home Valuation Report for This Property
The Home Valuation Report is an in-depth analysis detailing your home's value as well as a comparison with similar homes in the area
Home Values in the Area
Average Home Value in this Area
Purchase History
| Date | Buyer | Sale Price | Title Company |
|---|---|---|---|
| May William | $12,533 | None Available | |
| May William | $12,533 | None Available | |
| May William | $12,533 | None Available | |
| May William | -- | None Available | |
| May William | -- | None Available | |
| May William | -- | None Available | |
| May William | -- | None Available | |
| May William | -- | None Available | |
| May William | -- | None Available | |
| May Lori C | $55,000 | -- | |
| May Lori C | $55,000 | -- | |
| May Lori C | $55,000 | -- |
Source: Public Records
Tax History
| Year | Tax Paid | Tax Assessment Tax Assessment Total Assessment is a certain percentage of the fair market value that is determined by local assessors to be the total taxable value of land and additions on the property. | Land | Improvement |
|---|---|---|---|---|
| 2025 | $3,660 | $207,600 | $76,400 | $131,200 |
| 2024 | $3,560 | $207,600 | $76,400 | $131,200 |
| 2023 | $0 | $207,600 | $76,400 | $131,200 |
| 2022 | $3,456 | $141,700 | $62,100 | $79,600 |
| 2021 | $3,289 | $141,700 | $62,100 | $79,600 |
| 2020 | $3,236 | $141,700 | $62,100 | $79,600 |
| 2019 | $3,238 | $144,100 | $62,100 | $82,000 |
| 2018 | $3,164 | $144,100 | $62,100 | $82,000 |
| 2017 | $1,692 | $66,200 | $23,600 | $42,600 |
| 2016 | $2,129 | $84,400 | $23,500 | $60,900 |
| 2015 | $1,511 | $60,550 | $16,450 | $44,100 |
| 2011 | $2,001 | $93,000 | $23,400 | $69,600 |
Source: Public Records
Map
Nearby Homes
- 69 Cheney St
- 261 N Main St
- 0 Rowell Dr Unit 406 5043422
- 416 Central St
- 29 Elkins St
- 88 Franklin St
- 5 Evans Ct
- 10 Chance Pond Rd
- lot 24 Route 11
- 2 Hutchinson St
- 18 Highland Ave
- 00 Summit St Unit 402
- 27 Bond St
- Lot 4 Piper St
- 632 Central St
- 15 Trail St
- 225 Kendall St
- 24 Munroe St Unit 1&2
- 10 Eagle Nest Dr
- 21 Lake Ave
Your Personal Tour Guide
Ask me questions while you tour the home.