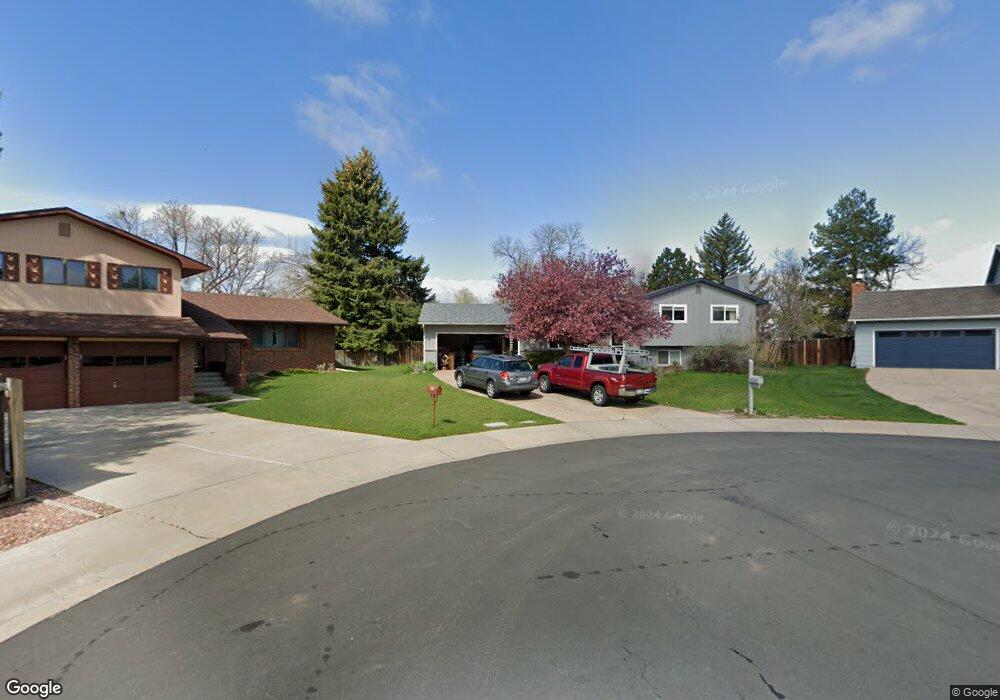
1620 Independence Ct Fort Collins, CO 80526
Estimated Value: $543,900 - $607,000
4
Beds
3
Baths
1,672
Sq Ft
$346/Sq Ft
Est. Value
About This Home
This home is located at 1620 Independence Ct, Fort Collins, CO 80526 and is currently estimated at $577,725, approximately $345 per square foot. 1620 Independence Ct is a home located in Larimer County with nearby schools including Bennett Elementary School, Blevins Middle School, and Rocky Mountain High School.
Ownership History
Date
Name
Owned For
Owner Type
Purchase Details
Closed on
Dec 14, 2006
Sold by
Prudential Relocation Inc
Bought by
Archuleta Cassie M and Archuleta Ruben U
Current Estimated Value
Home Financials for this Owner
Home Financials are based on the most recent Mortgage that was taken out on this home.
Original Mortgage
$40,000
Interest Rate
6.27%
Mortgage Type
Purchase Money Mortgage
Purchase Details
Closed on
Sep 5, 2000
Sold by
Anderson Patricia L
Bought by
Swenson John A and Swenson Aileen B
Home Financials for this Owner
Home Financials are based on the most recent Mortgage that was taken out on this home.
Original Mortgage
$173,600
Interest Rate
8.16%
Purchase Details
Closed on
Aug 1, 1994
Sold by
Anderson Robert E
Bought by
Anderson Patricia L
Create a Home Valuation Report for This Property
The Home Valuation Report is an in-depth analysis detailing your home's value as well as a comparison with similar homes in the area
Home Values in the Area
Average Home Value in this Area
Purchase History
| Date | Buyer | Sale Price | Title Company |
|---|---|---|---|
| Archuleta Cassie M | $200,000 | Chicago Title Co | |
| Prudential Relocation Inc | $200,000 | Chicago Title Co | |
| Swenson John A | $182,750 | North American Title Co | |
| Anderson Patricia L | -- | -- |
Source: Public Records
Mortgage History
| Date | Status | Borrower | Loan Amount |
|---|---|---|---|
| Closed | Prudential Relocation Inc | $40,000 | |
| Open | Archuleta Cassie M | $160,000 | |
| Previous Owner | Swenson John A | $173,600 |
Source: Public Records
Tax History Compared to Growth
Tax History
| Year | Tax Paid | Tax Assessment Tax Assessment Total Assessment is a certain percentage of the fair market value that is determined by local assessors to be the total taxable value of land and additions on the property. | Land | Improvement |
|---|---|---|---|---|
| 2025 | $3,100 | $35,992 | $3,015 | $32,977 |
| 2024 | $2,949 | $35,992 | $3,015 | $32,977 |
| 2022 | $2,701 | $28,607 | $3,128 | $25,479 |
| 2021 | $2,730 | $29,430 | $3,218 | $26,212 |
| 2020 | $2,592 | $27,700 | $3,218 | $24,482 |
| 2019 | $2,603 | $27,700 | $3,218 | $24,482 |
| 2018 | $2,223 | $24,386 | $3,240 | $21,146 |
| 2017 | $2,215 | $24,386 | $3,240 | $21,146 |
| 2016 | $1,970 | $21,580 | $3,582 | $17,998 |
| 2015 | $1,956 | $21,580 | $3,580 | $18,000 |
| 2014 | $1,602 | $17,560 | $3,580 | $13,980 |
Source: Public Records
Map
Nearby Homes
- 1701 Glenwood Dr
- 1513 Independence Rd
- 1854 Marlborough Ct
- 2404 Sheffield Cir E
- 1333 Village Park Ct
- 1757 Concord Dr
- 2420 Sheffield Cir E
- 1955 Kingsborough Dr
- 1300 W Stuart St Unit 23
- 2109 W Drake Rd
- 1705 Heatheridge Rd Unit A104
- 1705 Heatheridge Rd Unit K105
- 1705 Heatheridge Rd Unit L201
- 1705 Heatheridge Rd Unit E101
- 1705 Heatheridge Rd Unit M204
- 1705 Heatheridge Rd Unit G302
- 2206 Rambouillet Dr
- 1680 Foxbrook Way
- 2613 Hanover Dr
- 1112 Evenstar Ct
- 1616 Independence Ct
- 1624 Independence Ct
- 2112 Constitution Ave
- 2106 Constitution Ave
- 2118 Constitution Ave
- 1612 Independence Ct
- 2100 Constitution Ave
- 1632 Independence Rd
- 2124 Constitution Ave
- 1628 Independence Rd
- 1608 Independence Ct
- 2019 Winfield Ct
- 1636 Independence Rd
- 2030 Constitution Ave
- 2018 Winfield Ct
- 2130 Constitution Ave
- 1640 Independence Rd
- 1604 Independence Ct
- 2024 Constitution Ave
- 2013 Winfield Ct