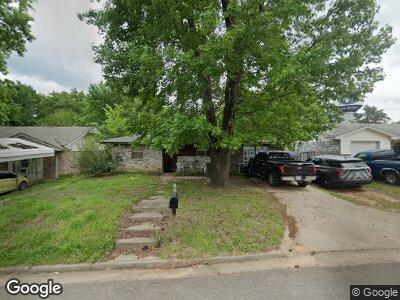
1622 N 10th Ave Durant, OK 74701
Estimated Value: $140,000 - $164,000
4
Beds
1
Bath
1,420
Sq Ft
$108/Sq Ft
Est. Value
About This Home
This home is located at 1622 N 10th Ave, Durant, OK 74701 and is currently estimated at $152,692, approximately $107 per square foot. 1622 N 10th Ave is a home located in Bryan County with nearby schools including Washington Irving Elementary School, Northwest Heights Elementary School, and Durant Intermediate Elementary School.
Ownership History
Date
Name
Owned For
Owner Type
Purchase Details
Closed on
Oct 11, 2021
Sold by
Derby Heather and Derby Heather Diane
Bought by
Derby Anthony
Current Estimated Value
Home Financials for this Owner
Home Financials are based on the most recent Mortgage that was taken out on this home.
Original Mortgage
$61,246
Outstanding Balance
$53,823
Interest Rate
2.8%
Mortgage Type
Closed End Mortgage
Purchase Details
Closed on
Jul 22, 1998
Sold by
Many Mansions, L.L.C and Many Mansions L
Bought by
Harvey Vernest and Harvey Carrie
Purchase Details
Closed on
Mar 20, 1994
Sold by
Schiebe Frank and Schiebe Margaret
Bought by
Many Mansions, L.L.C.
Purchase Details
Closed on
Aug 17, 1993
Sold by
Gilmore Bruce and Gilmore Others
Bought by
Schiebe Frank and Schiebe Margaret
Purchase Details
Closed on
Jul 15, 1993
Sold by
Gilmore Joann Dec'D
Bought by
Gilmore Bruce and Gilmore Karen
Create a Home Valuation Report for This Property
The Home Valuation Report is an in-depth analysis detailing your home's value as well as a comparison with similar homes in the area
Home Values in the Area
Average Home Value in this Area
Purchase History
| Date | Buyer | Sale Price | Title Company |
|---|---|---|---|
| Derby Anthony | -- | None Available | |
| Harvey Vernest | $49,000 | -- | |
| Many Mansions, L.L.C. | $32,000 | -- | |
| Schiebe Frank | $33,000 | -- | |
| Gilmore Bruce | -- | -- |
Source: Public Records
Mortgage History
| Date | Status | Borrower | Loan Amount |
|---|---|---|---|
| Open | Derby Anthony | $61,246 |
Source: Public Records
Tax History Compared to Growth
Tax History
| Year | Tax Paid | Tax Assessment Tax Assessment Total Assessment is a certain percentage of the fair market value that is determined by local assessors to be the total taxable value of land and additions on the property. | Land | Improvement |
|---|---|---|---|---|
| 2024 | $804 | $8,251 | $1,469 | $6,782 |
| 2023 | $804 | $7,858 | $1,469 | $6,389 |
| 2022 | $733 | $7,812 | $1,459 | $6,353 |
| 2021 | $715 | $7,440 | $1,375 | $6,065 |
| 2020 | $681 | $7,086 | $1,295 | $5,791 |
| 2019 | $612 | $6,748 | $1,219 | $5,529 |
| 2018 | $578 | $6,428 | $1,183 | $5,245 |
| 2017 | $547 | $6,122 | $1,164 | $4,958 |
| 2016 | $525 | $5,830 | $1,100 | $4,730 |
| 2015 | $581 | $7,478 | $1,373 | $6,105 |
| 2014 | $581 | $7,478 | $1,373 | $6,105 |
Source: Public Records
Map
Nearby Homes
- 1003 Four Seasons Dr
- 1019 Four Seasons Dr
- 988 Wilson St
- 824 Wilson St
- 1107 Wilson St
- 114 Wilson Loop
- 0 Wilson St
- 907 Briarwood Place
- 2300 Woodland Springs Dr
- 906 Briarwood Place
- 1214 Denison St
- 927 Crooked Oak Dr
- 1124 N 12th Ave
- 1302 N 7th Ave
- 1223 Grand Ave
- 1303 N 6th Ave
- 1419 W University Blvd
- 1418 Baltimore St
- 1420 Baltimore St
- 1832 Red Fox Rd
- 1622 N 10th Ave
- 1624 N 10th Ave
- 1620 N 10th Ave
- 0 N 10th Ave Unit 1723410
- 1618 N 10th Ave
- 1628 N 10th Ave
- 1625 N 9th Ave
- 1627 N 9th Ave
- 1623 N 9th Ave
- 1616 N 10th Ave
- 1621 N 9th Ave
- 1629 N 9th Ave
- 1623 N 10th Ave
- 1621 N 10th Ave
- 1625 N 10th Ave
- 1627 N 10th Ave
- 1619 N 9th Ave
- 1710 N 10th Ave
- 1614 N 10th Ave