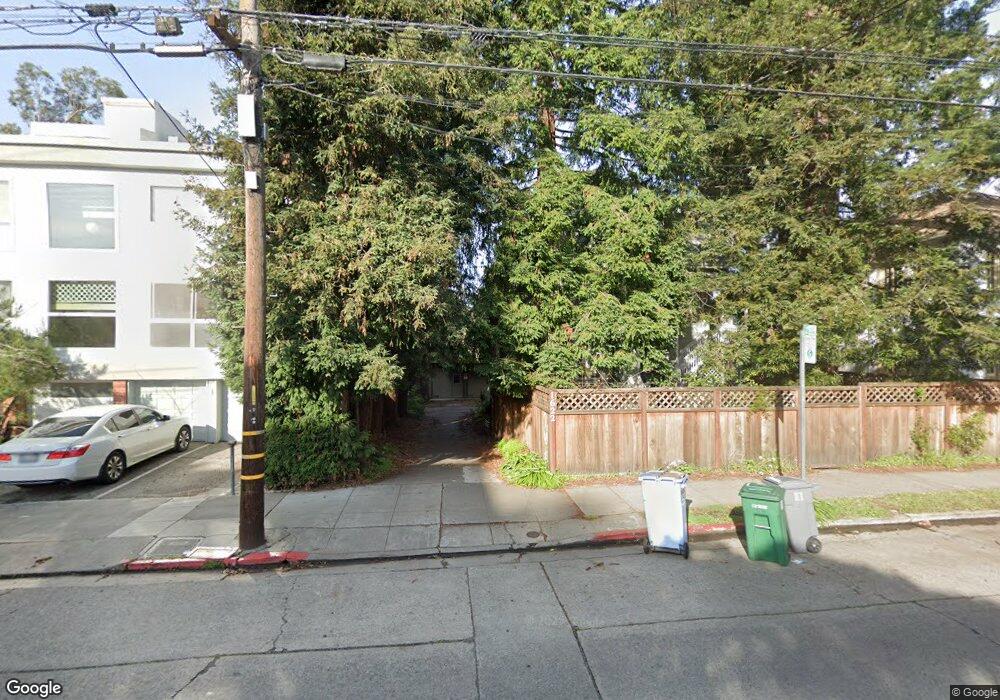
1622 Oxford St Unit N Berkeley, CA 94709
North Berkeley NeighborhoodEstimated Value: $668,000 - $806,000
2
Beds
1
Bath
800
Sq Ft
$894/Sq Ft
Est. Value
About This Home
This home is located at 1622 Oxford St Unit N, Berkeley, CA 94709 and is currently estimated at $714,813, approximately $893 per square foot. 1622 Oxford St Unit N is a home located in Alameda County with nearby schools including Berkeley Arts Magnet at Whittier School, Washington Elementary School, and Cragmont Elementary School.
Ownership History
Date
Name
Owned For
Owner Type
Purchase Details
Closed on
Jul 5, 2013
Sold by
Chen Wei Yi and Chen Tai Hua
Bought by
Bithar Vibhu and Dubey Namrata
Current Estimated Value
Home Financials for this Owner
Home Financials are based on the most recent Mortgage that was taken out on this home.
Original Mortgage
$397,000
Outstanding Balance
$289,408
Interest Rate
3.98%
Mortgage Type
New Conventional
Estimated Equity
$425,405
Purchase Details
Closed on
Apr 13, 2006
Sold by
Altman Daniel and Altman Nancy
Bought by
Chen Wei Yi and Chen Tai Hua
Home Financials for this Owner
Home Financials are based on the most recent Mortgage that was taken out on this home.
Original Mortgage
$394,400
Interest Rate
4.87%
Mortgage Type
Fannie Mae Freddie Mac
Purchase Details
Closed on
Jul 25, 2005
Sold by
Altman Daniel and Altman Nancy
Bought by
Altman Daniel and Altman Nancy
Create a Home Valuation Report for This Property
The Home Valuation Report is an in-depth analysis detailing your home's value as well as a comparison with similar homes in the area
Home Values in the Area
Average Home Value in this Area
Purchase History
We collect this data history from publicly available records. To have your information removed, we recommend requesting removal directly through your county’s website.
| Date | Buyer | Sale Price | Title Company |
|---|---|---|---|
| Bithar Vibhu | $530,000 | Placer Title Company | |
| Chen Wei Yi | $493,000 | Placer Title Company | |
| Altman Daniel | -- | First American Title Guarant |
Source: Public Records
Mortgage History
We collect this data history from publicly available records. To have your information removed, we recommend requesting removal directly through your county’s website.
| Date | Status | Borrower | Loan Amount |
|---|---|---|---|
| Open | Bithar Vibhu | $397,000 | |
| Previous Owner | Chen Wei Yi | $394,400 |
Source: Public Records
Tax History
| Year | Tax Paid | Tax Assessment Tax Assessment Total Assessment is a certain percentage of the fair market value that is determined by local assessors to be the total taxable value of land and additions on the property. | Land | Improvement |
|---|---|---|---|---|
| 2025 | $9,267 | $649,678 | $194,903 | $454,775 |
| 2024 | $9,267 | $636,943 | $191,083 | $445,860 |
| 2023 | $9,082 | $624,455 | $187,336 | $437,119 |
| 2022 | $8,938 | $612,213 | $183,664 | $428,549 |
| 2021 | $8,970 | $600,214 | $180,064 | $420,150 |
| 2020 | $8,549 | $594,060 | $178,218 | $415,842 |
| 2019 | $8,276 | $582,416 | $174,725 | $407,691 |
| 2018 | $8,063 | $571,000 | $171,300 | $399,700 |
| 2017 | $7,775 | $559,807 | $167,942 | $391,865 |
| 2016 | $7,562 | $548,830 | $164,649 | $384,181 |
| 2015 | $7,466 | $540,588 | $162,176 | $378,412 |
| 2014 | $7,429 | $530,000 | $159,000 | $371,000 |
Source: Public Records
Map
Nearby Homes
- 1622 Oxford St Unit B
- 1682 Oxford St
- 1643 Walnut St
- 2201 Virginia St Unit 2
- 1734 Spruce St
- 1739 Spruce St
- 2301 Virginia St Unit 1
- 1444 Walnut St
- 2340 Virginia St
- 2378 Virginia St
- 1490 Arch St
- 1841 Spruce St Unit 1
- 2421 Hilgard Ave
- 1609 Bonita Ave Unit 5
- 1733 Milvia St
- 1408 Henry St
- 2451 Le Conte Ave
- 2477 Virginia St
- 2015 Hearst Ave
- 2009 Berkeley Way
- 1634 Oxford St
- 1644 Oxford St
- 1622 Oxford St Unit 5N
- 1622 Oxford St Unit 5W
- 1622 Oxford St
- 1622 Oxford St Unit W
- 1622 Oxford St Unit S
- 1622 Oxford St Unit T
- 1650 Oxford St
- 1612 Oxford St
- 1652 Oxford St
- 1609 Walnut St
- 1619 Walnut St
- 1608 Oxford St
- 1607 Walnut St
- 1617 Walnut St
- 1623 Walnut St
- 1600 Oxford St
- 1643 Oxford St
- 1625 Walnut St
Your Personal Tour Guide
Ask me questions while you tour the home.