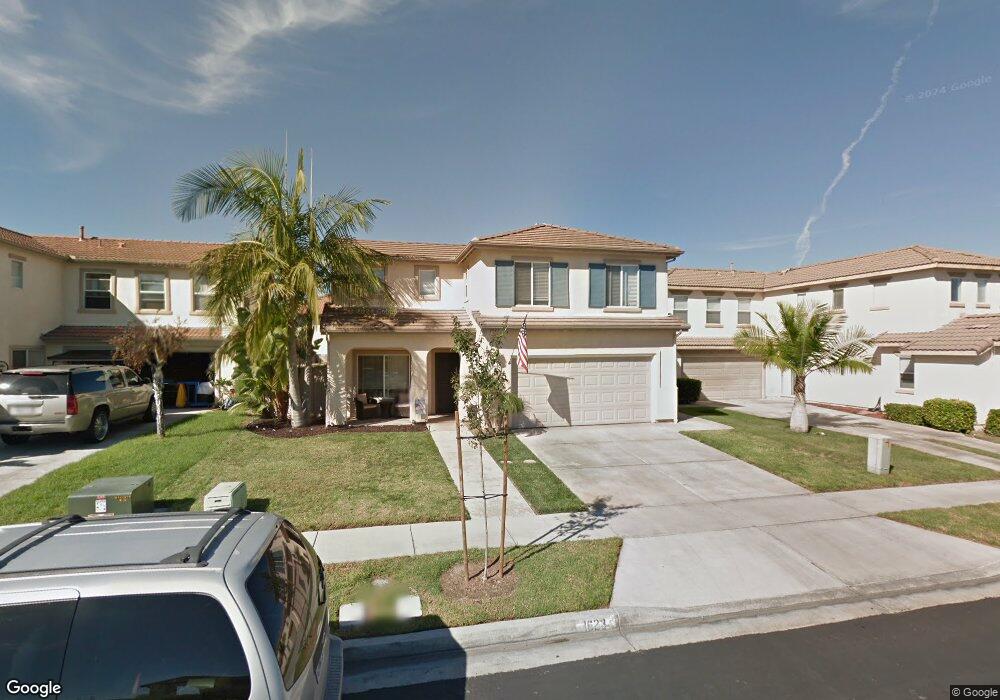
1623 Applegate St Chula Vista, CA 91913
Otay Ranch Village NeighborhoodEstimated Value: $853,000 - $897,000
4
Beds
3
Baths
1,708
Sq Ft
$513/Sq Ft
Est. Value
About This Home
This home is located at 1623 Applegate St, Chula Vista, CA 91913 and is currently estimated at $875,802, approximately $512 per square foot. 1623 Applegate St is a home located in San Diego County with nearby schools including Heritage Elementary School, Rancho Del Rey Middle School, and Otay Ranch Senior High School.
Ownership History
Date
Name
Owned For
Owner Type
Purchase Details
Closed on
Jul 16, 2009
Sold by
Lopez Francisco J and Lopez Maria T
Bought by
Foster Joseph K and Foster Shelley Ann
Current Estimated Value
Home Financials for this Owner
Home Financials are based on the most recent Mortgage that was taken out on this home.
Original Mortgage
$337,095
Outstanding Balance
$217,537
Interest Rate
5.09%
Mortgage Type
VA
Estimated Equity
$658,265
Purchase Details
Closed on
Jun 13, 2005
Sold by
Barrington Brad and Barrington Holly
Bought by
Lopez Francisco J and Lopez Maria T
Home Financials for this Owner
Home Financials are based on the most recent Mortgage that was taken out on this home.
Original Mortgage
$395,500
Interest Rate
5.05%
Mortgage Type
Negative Amortization
Purchase Details
Closed on
Nov 12, 1999
Sold by
Centex Homes
Bought by
Salazar Guillermo and Salazar Araceli
Home Financials for this Owner
Home Financials are based on the most recent Mortgage that was taken out on this home.
Original Mortgage
$193,200
Interest Rate
8.34%
Create a Home Valuation Report for This Property
The Home Valuation Report is an in-depth analysis detailing your home's value as well as a comparison with similar homes in the area
Home Values in the Area
Average Home Value in this Area
Purchase History
| Date | Buyer | Sale Price | Title Company |
|---|---|---|---|
| Foster Joseph K | $330,000 | First American Title | |
| Lopez Francisco J | $565,000 | Southland Title Corporation | |
| Salazar Guillermo | $215,000 | First American Title |
Source: Public Records
Mortgage History
| Date | Status | Borrower | Loan Amount |
|---|---|---|---|
| Open | Foster Joseph K | $337,095 | |
| Previous Owner | Lopez Francisco J | $395,500 | |
| Previous Owner | Salazar Guillermo | $193,200 |
Source: Public Records
Tax History Compared to Growth
Tax History
| Year | Tax Paid | Tax Assessment Tax Assessment Total Assessment is a certain percentage of the fair market value that is determined by local assessors to be the total taxable value of land and additions on the property. | Land | Improvement |
|---|---|---|---|---|
| 2025 | $7,383 | $425,957 | $158,613 | $267,344 |
| 2024 | $7,383 | $417,605 | $155,503 | $262,102 |
| 2023 | $7,258 | $409,417 | $152,454 | $256,963 |
| 2022 | $7,058 | $401,390 | $149,465 | $251,925 |
| 2021 | $6,920 | $393,521 | $146,535 | $246,986 |
| 2020 | $6,771 | $389,487 | $145,033 | $244,454 |
| 2019 | $6,612 | $381,851 | $142,190 | $239,661 |
| 2018 | $6,504 | $374,364 | $139,402 | $234,962 |
| 2017 | $6,386 | $367,024 | $136,669 | $230,355 |
| 2016 | $6,175 | $359,829 | $133,990 | $225,839 |
| 2015 | $6,032 | $354,425 | $131,978 | $222,447 |
| 2014 | $6,020 | $347,483 | $129,393 | $218,090 |
Source: Public Records
Map
Nearby Homes
- 1631 Applegate St
- 1518 Piedmont St
- 1567 Pleasanton Rd
- 1760 E Palomar St Unit 318
- 1760 E Palomar St Unit 111
- 1781 Camino Strava Unit 1
- 1719 Avenida Tealing Unit 2
- 1711 Avenida Tealing
- 1236 Bolinas Bay Ct
- 779 Caminito Francisco Unit 1
- 1566 Calle de La Flor Unit 2
- 1518 Caminito Soria Unit 2
- 1757 Via Capri
- 1401 Caminito Capistrano Unit 1
- 1402 Antioch Ave
- 1153 Gustine St
- 1733 Mendota St
- 1306 Mill Valley Rd
- 1633 Quailsprings Ct
- 1285 Fools Gold Way Unit 2
- 1627 Applegate St
- 1619 Applegate St
- 1618 Piedmont St
- 1622 Piedmont St
- 1615 Applegate St
- 1614 Piedmont St
- 1601 Grayson Ct
- 1626 Piedmont St
- 1602 Greenfield Ct
- 1635 Applegate St
- 1611 Applegate St
- 1610 Piedmont St
- 1630 Piedmont St
- 1605 Grayson Ct
- 1606 Greenfield Ct
- 1600 Grayson Ct
- 1639 Applegate St
- 1607 Applegate St
- 1606 Piedmont St
- 1609 Grayson Ct