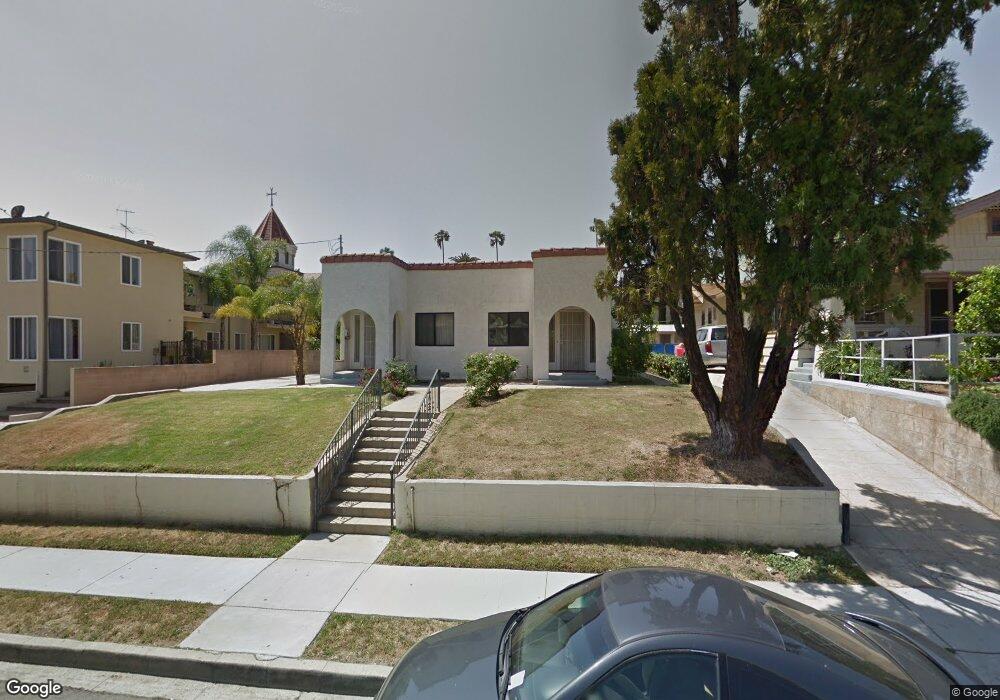
1623 N Kenmore Ave Los Angeles, CA 90027
East Hollywood NeighborhoodEstimated Value: $1,179,000 - $1,753,000
3
Beds
2
Baths
2,305
Sq Ft
$667/Sq Ft
Est. Value
About This Home
This home is located at 1623 N Kenmore Ave, Los Angeles, CA 90027 and is currently estimated at $1,538,266, approximately $667 per square foot. 1623 N Kenmore Ave is a home located in Los Angeles County with nearby schools including Los Feliz STEMM Magnet, Thomas Starr King Middle School Film and Media Magnet, and John Marshall Senior High.
Ownership History
Date
Name
Owned For
Owner Type
Purchase Details
Closed on
Mar 4, 2009
Sold by
Deutsche Bank Trust Company Americas
Bought by
Berberian Nick
Current Estimated Value
Purchase Details
Closed on
Mar 17, 2008
Sold by
Razvi Syed M
Bought by
Deutsche Bank Trust Co Americas
Purchase Details
Closed on
Jan 11, 2007
Sold by
Ambalappurath Shaniba
Bought by
Razvi Syed M
Home Financials for this Owner
Home Financials are based on the most recent Mortgage that was taken out on this home.
Original Mortgage
$620,000
Interest Rate
6.21%
Mortgage Type
Purchase Money Mortgage
Purchase Details
Closed on
Jan 4, 2007
Sold by
Tahtakran Onik and Tahtakran Siroun
Bought by
Razvi Syed M
Home Financials for this Owner
Home Financials are based on the most recent Mortgage that was taken out on this home.
Original Mortgage
$620,000
Interest Rate
6.21%
Mortgage Type
Purchase Money Mortgage
Create a Home Valuation Report for This Property
The Home Valuation Report is an in-depth analysis detailing your home's value as well as a comparison with similar homes in the area
Home Values in the Area
Average Home Value in this Area
Purchase History
| Date | Buyer | Sale Price | Title Company |
|---|---|---|---|
| Berberian Nick | $541,500 | First American Title Ins Co | |
| Deutsche Bank Trust Co Americas | $658,504 | None Available | |
| Razvi Syed M | -- | Fidelity National Financial | |
| Razvi Syed M | -- | Fidelity Van Nuys |
Source: Public Records
Mortgage History
| Date | Status | Borrower | Loan Amount |
|---|---|---|---|
| Previous Owner | Razvi Syed M | $620,000 | |
| Previous Owner | Razvi Syed M | $620,000 |
Source: Public Records
Tax History Compared to Growth
Tax History
| Year | Tax Paid | Tax Assessment Tax Assessment Total Assessment is a certain percentage of the fair market value that is determined by local assessors to be the total taxable value of land and additions on the property. | Land | Improvement |
|---|---|---|---|---|
| 2025 | $8,674 | $696,790 | $488,054 | $208,736 |
| 2024 | $8,674 | $683,129 | $478,485 | $204,644 |
| 2023 | $8,512 | $669,735 | $469,103 | $200,632 |
| 2022 | $8,125 | $656,604 | $459,905 | $196,699 |
| 2021 | $8,020 | $643,731 | $450,888 | $192,843 |
| 2019 | $7,786 | $624,639 | $437,515 | $187,124 |
| 2018 | $7,649 | $612,392 | $428,937 | $183,455 |
| 2016 | $7,301 | $588,614 | $412,282 | $176,332 |
| 2015 | $7,197 | $579,774 | $406,090 | $173,684 |
| 2014 | $7,230 | $568,418 | $398,136 | $170,282 |
Source: Public Records
Map
Nearby Homes
- 1614 N Kenmore Ave
- 1548 N Alexandria Ave
- 1727 N Kenmore Ave
- 1730 N Kenmore Ave
- 1624 N Normandie Ave Unit B
- 1748 N Kenmore Ave Unit 203
- 1730 N Berendo St
- 1754 N Berendo St
- 1832 N Alexandria Ave
- 1425 N Normandie Ave
- 1860 Alexandria Ave
- 1901 N Catalina St
- 1845 N New Hampshire Ave
- 1640 N Harvard Blvd
- 1860 Winona Blvd
- 1811 N Kingsley Dr
- 1610 N Hobart Blvd
- 1927 N Normandie Ave
- 1964 Palmerston Place
- 5163 Franklin Ave
- 1629 N Kenmore Ave
- 1635 N Kenmore Ave
- N Alexandria Ave
- 1620 N Alexandria Ave
- 1628 N Alexandria Ave
- 1626 N Alexandria Ave
- 1641 N Kenmore Ave
- 1630 N Alexandria Ave
- 1622 N Kenmore Ave
- 1618 N Kenmore Ave Unit 8
- 1618 N Kenmore Ave Unit 4
- 1618 N Kenmore Ave Unit 6
- 1618 N Kenmore Ave Unit 1
- 1618 N Kenmore Ave Unit 5
- 1618 N Kenmore Ave Unit 2
- 1618 N Kenmore Ave Unit 3
- 1645 N Kenmore Ave
- 1640 N Alexandria Ave
- 1638 Alexandria Ave
- 1644 N Alexandria Ave