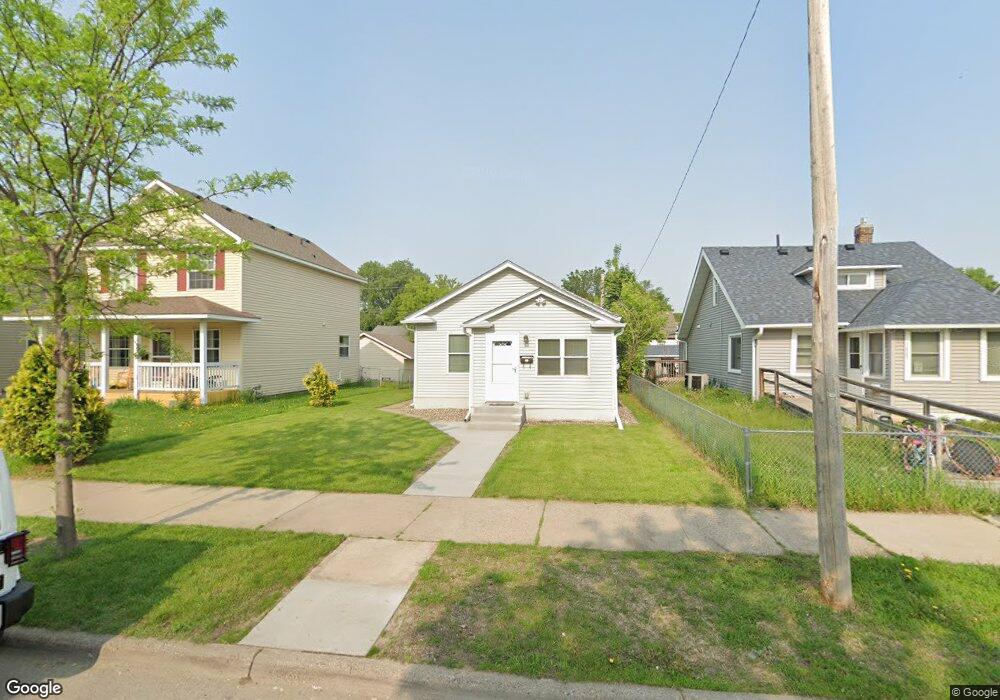
1623 Thomas Ave N Minneapolis, MN 55411
Willard-Hay NeighborhoodEstimated Value: $185,000 - $201,000
2
Beds
1
Bath
1,788
Sq Ft
$109/Sq Ft
Est. Value
About This Home
This home is located at 1623 Thomas Ave N, Minneapolis, MN 55411 and is currently estimated at $195,522, approximately $109 per square foot. 1623 Thomas Ave N is a home located in Hennepin County with nearby schools including Bryn Mawr Elementary School, Anwatin Middle School, and North High School.
Ownership History
Date
Name
Owned For
Owner Type
Purchase Details
Closed on
Jul 29, 2019
Sold by
Wherland Frederick and Wherland Virginia
Bought by
Doan Jessica
Current Estimated Value
Home Financials for this Owner
Home Financials are based on the most recent Mortgage that was taken out on this home.
Original Mortgage
$10,000
Outstanding Balance
$8,731
Interest Rate
3.55%
Mortgage Type
FHA
Estimated Equity
$186,791
Purchase Details
Closed on
Mar 3, 2011
Sold by
Olson Randall B and De Boer Jennifer
Bought by
Wherland Frederick and Wherland Virginia
Purchase Details
Closed on
Sep 29, 2010
Sold by
Olson Randall R
Bought by
Us Bank National Association
Purchase Details
Closed on
Jul 20, 2005
Sold by
Bank One Na
Bought by
Olson Randall R
Purchase Details
Closed on
Aug 20, 2001
Sold by
Smith Florestine B
Bought by
Smith William W
Create a Home Valuation Report for This Property
The Home Valuation Report is an in-depth analysis detailing your home's value as well as a comparison with similar homes in the area
Home Values in the Area
Average Home Value in this Area
Purchase History
| Date | Buyer | Sale Price | Title Company |
|---|---|---|---|
| Doan Jessica | $161,500 | Burnet Title | |
| Wherland Frederick | $25,868 | -- | |
| Us Bank National Association | $24,588 | -- | |
| Olson Randall R | $85,500 | -- | |
| Smith William W | $76,000 | -- |
Source: Public Records
Mortgage History
| Date | Status | Borrower | Loan Amount |
|---|---|---|---|
| Open | Doan Jessica | $10,000 | |
| Open | Doan Jessica | $153,425 |
Source: Public Records
Tax History
| Year | Tax Paid | Tax Assessment Tax Assessment Total Assessment is a certain percentage of the fair market value that is determined by local assessors to be the total taxable value of land and additions on the property. | Land | Improvement |
|---|---|---|---|---|
| 2024 | $2,194 | $176,000 | $21,000 | $155,000 |
| 2023 | $2,009 | $174,000 | $21,000 | $153,000 |
| 2022 | $1,670 | $159,000 | $16,000 | $143,000 |
| 2021 | $1,143 | $143,000 | $10,000 | $133,000 |
| 2020 | $1,086 | $110,000 | $14,600 | $95,400 |
| 2019 | $1,505 | $100,000 | $9,700 | $90,300 |
| 2018 | $1,464 | $87,000 | $9,700 | $77,300 |
| 2017 | $1,692 | $85,500 | $8,800 | $76,700 |
| 2016 | $1,465 | $78,500 | $8,800 | $69,700 |
| 2015 | $1,528 | $78,500 | $8,800 | $69,700 |
| 2014 | -- | $68,500 | $8,800 | $59,700 |
Source: Public Records
Map
Nearby Homes
- 1651 Thomas Ave N
- 1635 Sheridan Ave N
- 1700 Sheridan Ave N
- 1415 Thomas Ave N
- 1411 Upton Ave N
- 2705 Golden Valley Rd
- 1423 Penn Ave N
- 2014 Thomas Ave N
- 1519 Oliver Ave N
- 1600 Oliver Ave N
- 2024 Queen Ave N
- 1211 Vincent Ave N
- 1912 15th Ave N
- 1942 Oliver Ave N
- 2303 Upton Ave N
- 1110 Thomas Ave N
- 1214 Penn Ave N
- 1223 Oliver Ave N
- 1950 Newton Ave N
- 1501 Logan Ave N
- 1627 Thomas Ave N
- 1619 Thomas Ave N
- 1631 Thomas Ave N
- 1615 Thomas Ave N
- 1635 Thomas Ave N
- 1609 Thomas Ave N
- 1622 Upton Ave N
- 1618 Upton Ave N
- 1626 Upton Ave N
- 1639 Thomas Ave N
- 1614 Upton Ave N
- 1630 Upton Ave N
- 1610 Upton Ave N
- 1622 Thomas Ave N
- 1626 Thomas Ave N
- 1618 Thomas Ave N
- 1643 Thomas Ave N
- 1601 Thomas Ave N
- 1630 Thomas Ave N
- 1614 Thomas Ave N
Your Personal Tour Guide
Ask me questions while you tour the home.