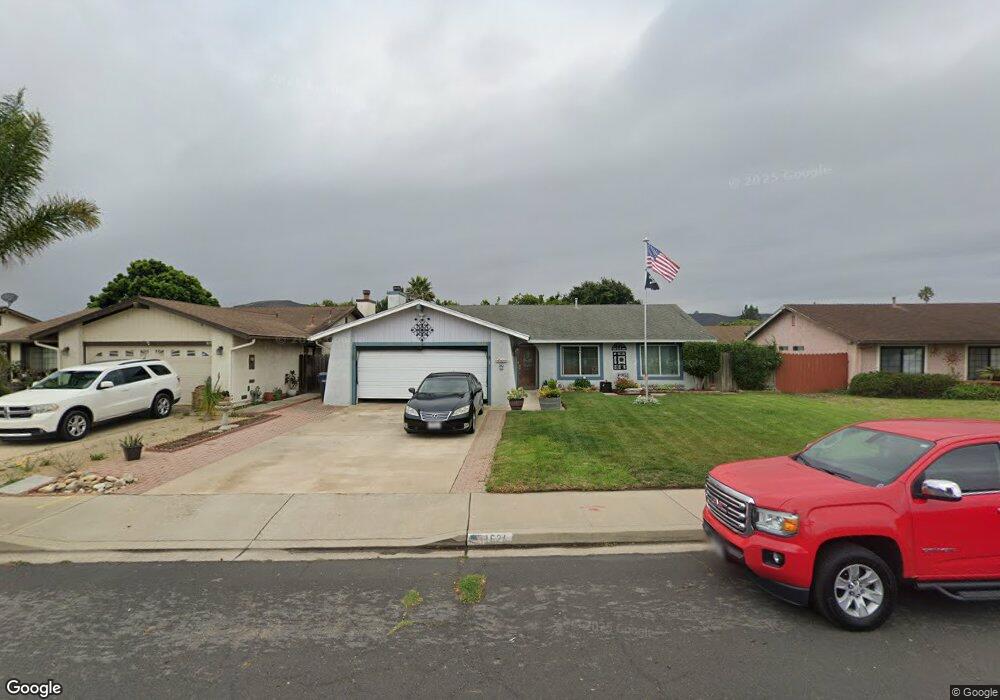
1624 E Nectarine Ave Unit 2 Lompoc, CA 93436
Estimated Value: $557,000 - $699,000
3
Beds
2
Baths
1,564
Sq Ft
$394/Sq Ft
Est. Value
About This Home
This home is located at 1624 E Nectarine Ave Unit 2, Lompoc, CA 93436 and is currently estimated at $615,593, approximately $393 per square foot. 1624 E Nectarine Ave Unit 2 is a home located in Santa Barbara County with nearby schools including Leonora Fillmore Elementary School, Lompoc Valley Middle School, and Lompoc High School.
Ownership History
Date
Name
Owned For
Owner Type
Purchase Details
Closed on
Jun 14, 1999
Sold by
Kevin Pham and Nguyen Kim Hue
Bought by
Rietz Philip K and Rietz Jeanie S
Current Estimated Value
Home Financials for this Owner
Home Financials are based on the most recent Mortgage that was taken out on this home.
Original Mortgage
$162,500
Outstanding Balance
$44,484
Interest Rate
7.51%
Mortgage Type
VA
Estimated Equity
$571,109
Purchase Details
Closed on
Jul 14, 1997
Sold by
Tung Pham
Bought by
Pham Kevin and Nguyen Kim Hue
Home Financials for this Owner
Home Financials are based on the most recent Mortgage that was taken out on this home.
Original Mortgage
$136,800
Interest Rate
7.23%
Purchase Details
Closed on
May 4, 1994
Sold by
Tellis Gregory and Tellis Jacqueline Y
Bought by
Pham Kevin and Nguyen Kim Hue
Home Financials for this Owner
Home Financials are based on the most recent Mortgage that was taken out on this home.
Original Mortgage
$144,400
Interest Rate
5.12%
Create a Home Valuation Report for This Property
The Home Valuation Report is an in-depth analysis detailing your home's value as well as a comparison with similar homes in the area
Home Values in the Area
Average Home Value in this Area
Purchase History
| Date | Buyer | Sale Price | Title Company |
|---|---|---|---|
| Rietz Philip K | $163,500 | Chicago Title Co | |
| Pham Kevin | -- | Lawyers Title Company | |
| Pham Kevin | $152,000 | Chicago Title Company |
Source: Public Records
Mortgage History
| Date | Status | Borrower | Loan Amount |
|---|---|---|---|
| Open | Rietz Philip K | $162,500 | |
| Previous Owner | Pham Kevin | $136,800 | |
| Previous Owner | Pham Kevin | $144,400 |
Source: Public Records
Tax History
| Year | Tax Paid | Tax Assessment Tax Assessment Total Assessment is a certain percentage of the fair market value that is determined by local assessors to be the total taxable value of land and additions on the property. | Land | Improvement |
|---|---|---|---|---|
| 2025 | $2,600 | $243,587 | $92,205 | $151,382 |
| 2023 | $2,600 | $234,130 | $88,626 | $145,504 |
| 2022 | $2,552 | $229,540 | $86,889 | $142,651 |
| 2021 | $2,577 | $225,040 | $85,186 | $139,854 |
| 2020 | $2,549 | $222,733 | $84,313 | $138,420 |
| 2019 | $2,506 | $218,366 | $82,660 | $135,706 |
| 2018 | $2,465 | $214,086 | $81,040 | $133,046 |
| 2017 | $2,419 | $209,889 | $79,451 | $130,438 |
| 2016 | $2,373 | $205,775 | $77,894 | $127,881 |
| 2014 | $2,320 | $198,716 | $75,222 | $123,494 |
Source: Public Records
Map
Nearby Homes
- 1704 E Nectarine Ave
- 601 N Seventh St
- 1735 River Vista Way
- 493 Live Oak Rd
- 1725 Autumn Sage Place
- 1741 River Vista Way
- 1744 River Vista Way
- 1742 River Vista Way
- 1740 River Vista Way
- 523 Live Oak Rd
- 535 Live Oak Rd
- 1739 River Vista Way
- 1729 Autumn Sage Place
- 1731 Autumn Sage Place
- 525 Live Oak Rd
- 1730 Autumn Sage Place
- 1727 Autumn Sage Place
- 1732 Autumn Sage Place
- 1743 River Vista Way
- 516 N 2nd St
- 1620 E Nectarine Ave
- 1628 E Nectarine Ave
- 1625 E Airport Ave
- 1629 E Airport Ave
- 1621 E Airport Ave
- 1616 E Nectarine Ave
- 1700 E Nectarine Ave
- 1617 E Airport Ave
- 1625 E Nectarine Ave
- 1629 E Nectarine Ave
- 1612 E Nectarine Ave
- 1621 E Nectarine Ave
- 1701 E Nectarine Ave
- 1705 E Airport Ave
- 1613 E Airport Ave
- 1617 E Nectarine Ave
- 709 Riverside Dr
- 1608 E Nectarine Ave
- 625 N 10th St
Your Personal Tour Guide
Ask me questions while you tour the home.