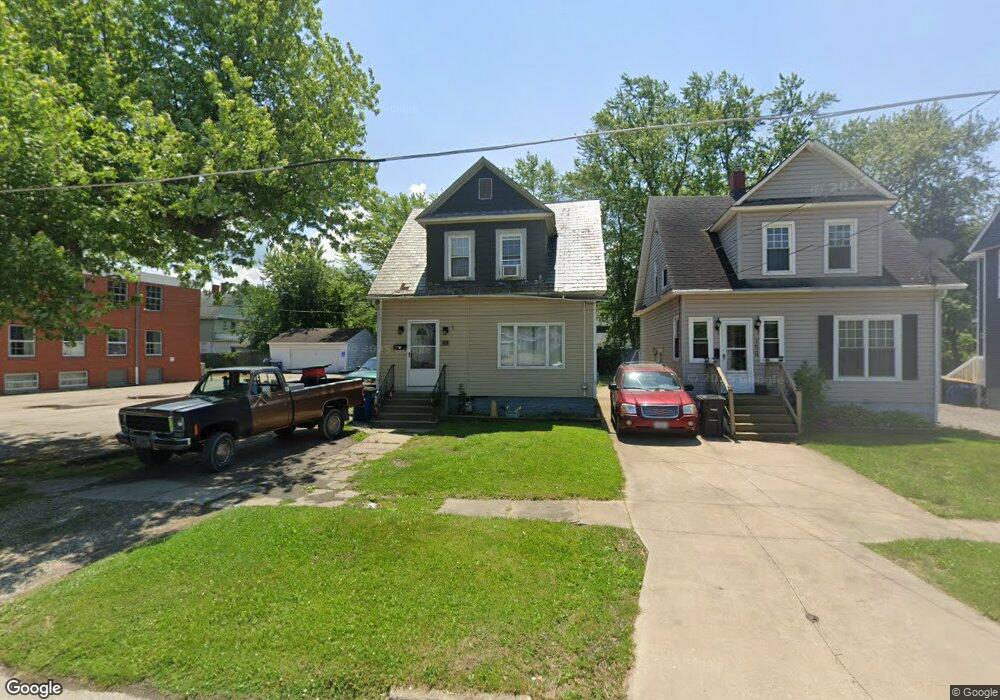
1624 W 3rd St Ashtabula, OH 44004
Estimated Value: $79,000 - $102,000
2
Beds
1
Bath
900
Sq Ft
$103/Sq Ft
Est. Value
About This Home
This home is located at 1624 W 3rd St, Ashtabula, OH 44004 and is currently estimated at $93,114, approximately $103 per square foot. 1624 W 3rd St is a home located in Ashtabula County with nearby schools including Lakeside High School and Christian Faith Academy.
Ownership History
Date
Name
Owned For
Owner Type
Purchase Details
Closed on
Aug 6, 2025
Sold by
Headlands Asset Management Fund Iii Seri
Bought by
Headlands Alternative Investments Lp
Current Estimated Value
Purchase Details
Closed on
Nov 4, 2015
Sold by
Harbour Portfolio Vi Lp
Bought by
Headlands Asset Management Fund Iii Seri
Purchase Details
Closed on
Jan 31, 2014
Sold by
Harbour Portfolio Vi Lp
Bought by
Ellingson Mark W and Vance Lolita
Purchase Details
Closed on
Nov 24, 2010
Sold by
Fannie Mae
Bought by
Harbour Portfolio Vi Lp
Purchase Details
Closed on
Aug 23, 2010
Sold by
Streets Douglas B
Bought by
Fanniemae and Federal National Mortgage Association
Create a Home Valuation Report for This Property
The Home Valuation Report is an in-depth analysis detailing your home's value as well as a comparison with similar homes in the area
Home Values in the Area
Average Home Value in this Area
Purchase History
| Date | Buyer | Sale Price | Title Company |
|---|---|---|---|
| Headlands Alternative Investments Lp | $39,100 | None Listed On Document | |
| Headlands Alternative Investments Lp | $39,100 | None Listed On Document | |
| Headlands Asset Management Fund Iii Seri | $22,480 | Attorney | |
| Ellingson Mark W | $32,900 | None Available | |
| Harbour Portfolio Vi Lp | $8,295 | Attorney | |
| Fanniemae | $12,000 | None Available |
Source: Public Records
Mortgage History
| Date | Status | Borrower | Loan Amount |
|---|---|---|---|
| Closed | Ellingson Mark W | $0 |
Source: Public Records
Tax History
| Year | Tax Paid | Tax Assessment Tax Assessment Total Assessment is a certain percentage of the fair market value that is determined by local assessors to be the total taxable value of land and additions on the property. | Land | Improvement |
|---|---|---|---|---|
| 2024 | $1,210 | $13,690 | $2,630 | $11,060 |
| 2023 | $737 | $13,690 | $2,630 | $11,060 |
| 2022 | $674 | $10,920 | $2,030 | $8,890 |
| 2021 | $679 | $10,920 | $2,030 | $8,890 |
| 2020 | $688 | $10,920 | $2,030 | $8,890 |
| 2019 | $1,038 | $16,070 | $2,140 | $13,930 |
| 2018 | $950 | $16,070 | $2,140 | $13,930 |
| 2017 | $929 | $16,070 | $2,140 | $13,930 |
| 2016 | $934 | $15,160 | $2,030 | $13,130 |
| 2015 | $1,818 | $15,160 | $2,030 | $13,130 |
| 2014 | $864 | $15,160 | $2,030 | $13,130 |
| 2013 | $3,258 | $14,290 | $1,860 | $12,430 |
Source: Public Records
Map
Nearby Homes
- 306 Pennsylvania Ave
- 1733 W 7th St
- 1010 Ohio Ave
- 1728 W 10th St
- 1028 Ohio Ave
- 1820 W 10th St
- 1031 Thayer Ave
- V/L W 12
- 725 Union Ave
- 2512 W 9th St
- 0 Scott Ave Unit 5167555
- 1203 Union Ave
- 814 Richards Ave
- 919 E 17th St
- 1606 Ohio Ave
- 2684 Burlingham Dr
- 1026 E 16th St
- E 20 St
- 1010 Brown Dr
- 1203 E 17th St
Your Personal Tour Guide
Ask me questions while you tour the home.