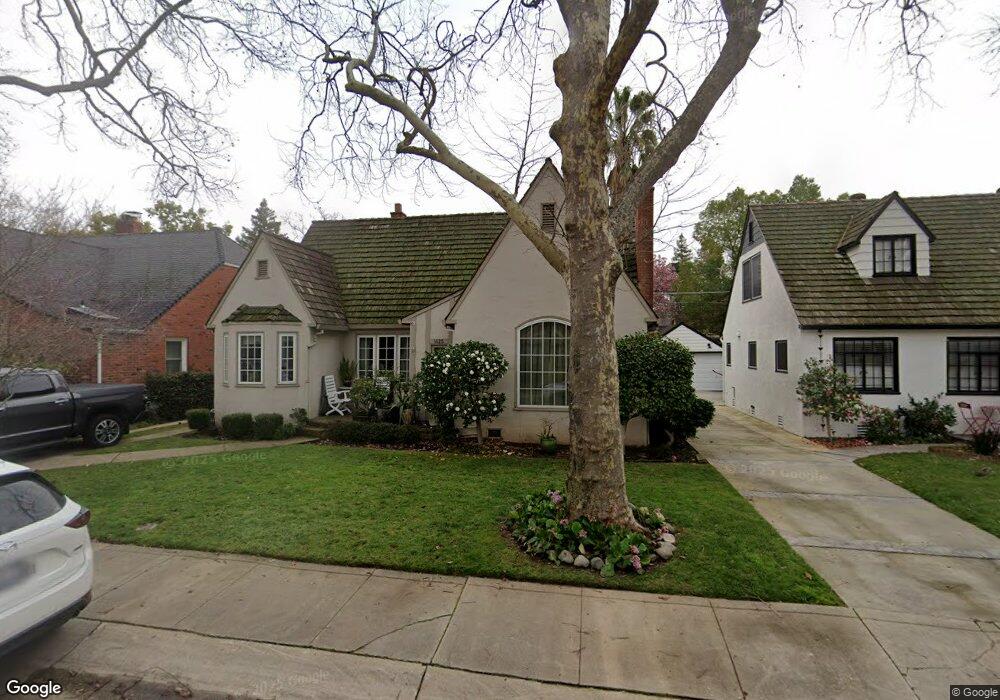
1625 Berkeley Way Sacramento, CA 95819
East Sacramento NeighborhoodEstimated Value: $777,000 - $1,058,000
3
Beds
1
Bath
1,600
Sq Ft
$543/Sq Ft
Est. Value
About This Home
This home is located at 1625 Berkeley Way, Sacramento, CA 95819 and is currently estimated at $868,209, approximately $542 per square foot. 1625 Berkeley Way is a home located in Sacramento County with nearby schools including David Lubin Elementary, Miwok Middle School, and Hiram W. Johnson High School.
Ownership History
Date
Name
Owned For
Owner Type
Purchase Details
Closed on
Jan 24, 2005
Sold by
Lundgren Sharon J and Lundgren Richard J
Bought by
Ten Fifteen Ii Llc
Current Estimated Value
Purchase Details
Closed on
Sep 26, 2001
Sold by
Bingham Jalena C
Bought by
Lundgren Richard L and Lundgren Sharon J
Purchase Details
Closed on
Mar 30, 1999
Sold by
Lou Grady Charles F and Lou Emmy
Bought by
Bingham Jalena C
Home Financials for this Owner
Home Financials are based on the most recent Mortgage that was taken out on this home.
Original Mortgage
$236,000
Interest Rate
6.91%
Purchase Details
Closed on
Sep 18, 1995
Sold by
Kennedy Kenneth H
Bought by
Grady Charles F and Grady Emmy Lou
Home Financials for this Owner
Home Financials are based on the most recent Mortgage that was taken out on this home.
Original Mortgage
$180,000
Interest Rate
7.88%
Create a Home Valuation Report for This Property
The Home Valuation Report is an in-depth analysis detailing your home's value as well as a comparison with similar homes in the area
Home Values in the Area
Average Home Value in this Area
Purchase History
| Date | Buyer | Sale Price | Title Company |
|---|---|---|---|
| Ten Fifteen Ii Llc | -- | -- | |
| Lundgren Richard L | $369,000 | Fidelity National Title Co | |
| Bingham Jalena C | $295,000 | Stewart Title | |
| Grady Charles F | $200,000 | Placer Title Company |
Source: Public Records
Mortgage History
| Date | Status | Borrower | Loan Amount |
|---|---|---|---|
| Previous Owner | Bingham Jalena C | $236,000 | |
| Previous Owner | Grady Charles F | $180,000 |
Source: Public Records
Tax History
| Year | Tax Paid | Tax Assessment Tax Assessment Total Assessment is a certain percentage of the fair market value that is determined by local assessors to be the total taxable value of land and additions on the property. | Land | Improvement |
|---|---|---|---|---|
| 2025 | $6,476 | $545,101 | $177,264 | $367,837 |
| 2024 | $6,476 | $534,414 | $173,789 | $360,625 |
| 2023 | $6,324 | $523,936 | $170,382 | $353,554 |
| 2022 | $6,218 | $513,664 | $167,042 | $346,622 |
| 2021 | $5,925 | $503,593 | $163,767 | $339,826 |
| 2020 | $5,975 | $498,430 | $162,088 | $336,342 |
| 2019 | $5,849 | $488,658 | $158,910 | $329,748 |
| 2018 | $5,698 | $479,078 | $155,795 | $323,283 |
| 2017 | $5,620 | $469,686 | $152,741 | $316,945 |
| 2016 | $5,443 | $460,478 | $149,747 | $310,731 |
| 2015 | $5,364 | $453,562 | $147,498 | $306,064 |
| 2014 | $5,217 | $444,678 | $144,609 | $300,069 |
Source: Public Records
Map
Nearby Homes
- 1633 Berkeley Way
- 1617 Berkeley Way
- 1624 42nd St
- 1641 Berkeley Way
- 1609 Berkeley Way
- 1616 42nd St
- 1632 42nd St
- 1608 42nd St
- 1640 42nd St
- 1624 Berkeley Way
- 1616 Berkeley Way
- 1632 Berkeley Way
- 1701 Berkeley Way
- 1601 Berkeley Way
- 1640 Berkeley Way
- 1608 Berkeley Way
- 1700 42nd St
- 1600 42nd St
- 1709 Berkeley Way
- 1700 Berkeley Way
Your Personal Tour Guide
Ask me questions while you tour the home.