Estimated Value: $286,000 - $373,000
--
Bed
--
Bath
--
Sq Ft
5,009
Sq Ft Lot
About This Home
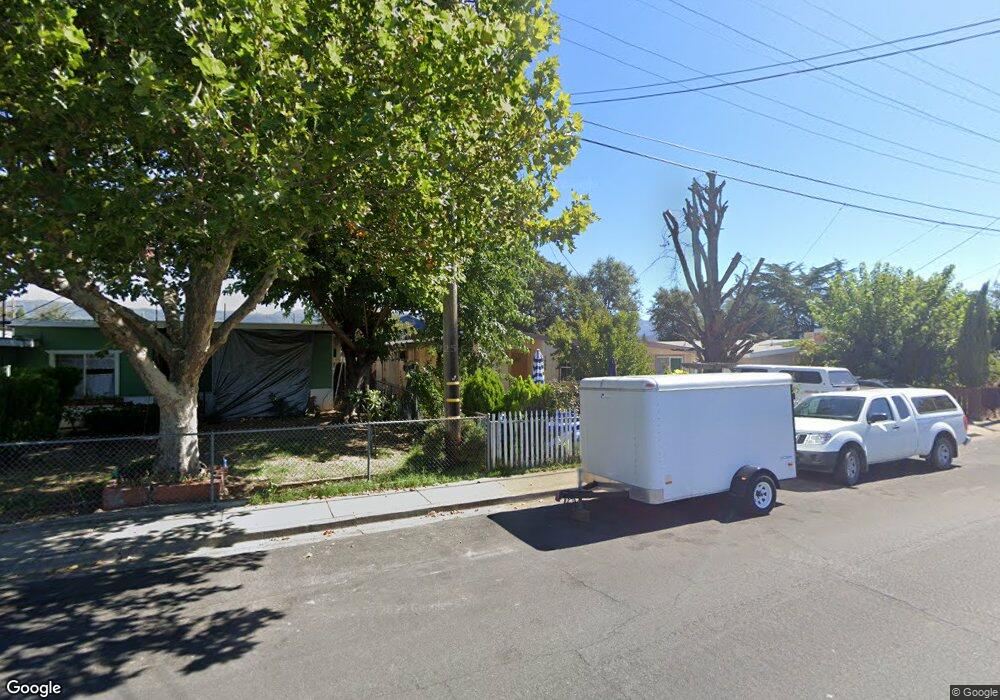
This home is located at 1625 Elm St, Ukiah, CA 95482 and is currently estimated at $322,176. 1625 Elm St is a home located in Mendocino County with nearby schools including Frank Zeek Elementary School, Pomolita Middle School, and Ukiah High School.
Ownership History
Date
Name
Owned For
Owner Type
Purchase Details
Closed on
Jul 23, 2014
Sold by
Ramirez Jesus and Morales Rigoberto Ramos
Bought by
Ramirez Jesus
Current Estimated Value
Home Financials for this Owner
Home Financials are based on the most recent Mortgage that was taken out on this home.
Original Mortgage
$150,000
Outstanding Balance
$114,127
Interest Rate
4.13%
Mortgage Type
Credit Line Revolving
Estimated Equity
$208,049
Purchase Details
Closed on
May 16, 2008
Sold by
Ramirez Jesus
Bought by
Ramirez Jesus and Morales Rigoberto Ramos
Purchase Details
Closed on
Mar 21, 2002
Sold by
Chapman Marvin and Chapman Joann
Bought by
Ramirez Jesus
Home Financials for this Owner
Home Financials are based on the most recent Mortgage that was taken out on this home.
Original Mortgage
$112,000
Interest Rate
6.36%
Mortgage Type
Purchase Money Mortgage
Create a Home Valuation Report for This Property
The Home Valuation Report is an in-depth analysis detailing your home's value as well as a comparison with similar homes in the area
Home Values in the Area
Average Home Value in this Area
Purchase History
| Date | Buyer | Sale Price | Title Company |
|---|---|---|---|
| Ramirez Jesus | -- | Redwood Empire Title Company | |
| Ramirez Jesus | -- | Fidelity Natl Title Co Of Ca | |
| Ramirez Jesus | $140,000 | First American Title |
Source: Public Records
Mortgage History
| Date | Status | Borrower | Loan Amount |
|---|---|---|---|
| Open | Ramirez Jesus | $150,000 | |
| Closed | Ramirez Jesus | $112,000 |
Source: Public Records
Tax History Compared to Growth
Tax History
| Year | Tax Paid | Tax Assessment Tax Assessment Total Assessment is a certain percentage of the fair market value that is determined by local assessors to be the total taxable value of land and additions on the property. | Land | Improvement |
|---|---|---|---|---|
| 2025 | $3,040 | $251,115 | $118,172 | $132,943 |
| 2023 | $3,040 | $241,366 | $113,584 | $127,782 |
| 2022 | $2,915 | $236,634 | $111,357 | $125,277 |
| 2021 | $2,809 | $231,995 | $109,174 | $122,821 |
| 2020 | $2,769 | $229,626 | $108,059 | $121,567 |
| 2019 | $2,614 | $225,124 | $105,941 | $119,183 |
| 2018 | $2,549 | $220,711 | $103,864 | $116,847 |
| 2017 | $2,508 | $216,385 | $101,828 | $114,557 |
| 2016 | $2,433 | $212,143 | $99,832 | $112,311 |
| 2015 | $2,413 | $208,957 | $98,333 | $110,624 |
| 2014 | $2,353 | $204,407 | $96,407 | $108,000 |
Source: Public Records
Map
Nearby Homes