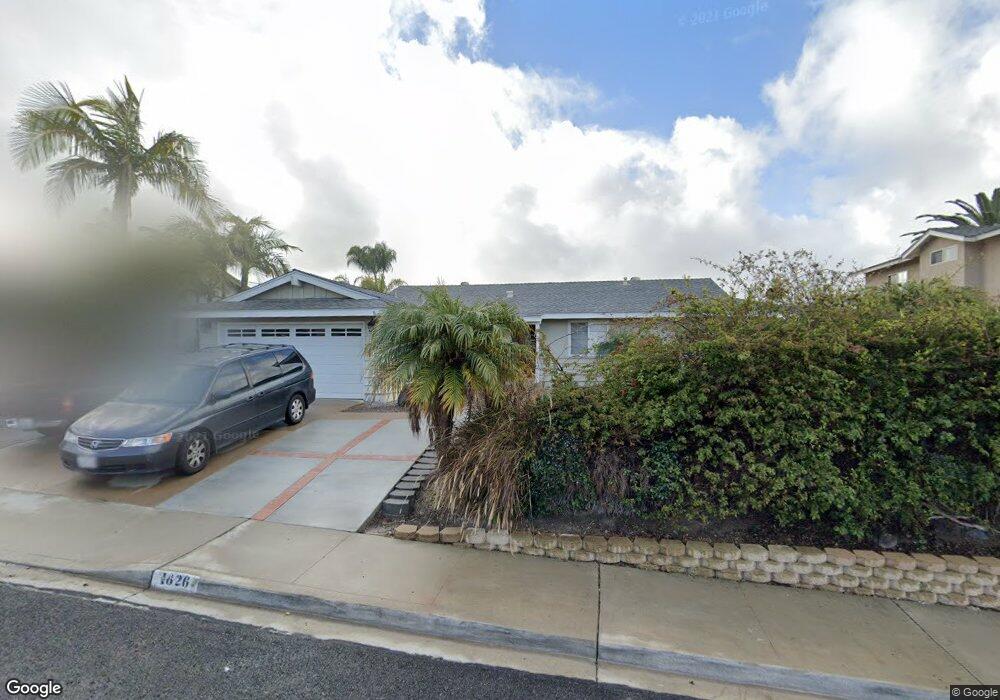
1626 Elmhurst St Chula Vista, CA 91913
Eastlake NeighborhoodEstimated Value: $834,000 - $953,000
3
Beds
2
Baths
1,381
Sq Ft
$651/Sq Ft
Est. Value
About This Home
This home is located at 1626 Elmhurst St, Chula Vista, CA 91913 and is currently estimated at $898,359, approximately $650 per square foot. 1626 Elmhurst St is a home located in San Diego County with nearby schools including Burton C. Tiffany Elementary School, Bonita Vista Middle School, and Bonita Vista Senior High School.
Ownership History
Date
Name
Owned For
Owner Type
Purchase Details
Closed on
Feb 16, 2017
Sold by
Bellama Randall S
Bought by
Garza Rafael and Garza Antonia Esperanza
Current Estimated Value
Home Financials for this Owner
Home Financials are based on the most recent Mortgage that was taken out on this home.
Original Mortgage
$393,750
Outstanding Balance
$314,384
Interest Rate
2.99%
Mortgage Type
Adjustable Rate Mortgage/ARM
Estimated Equity
$583,975
Purchase Details
Closed on
Jan 10, 2017
Sold by
Bellama Michael D and Bellama Jo Ann
Bought by
Bellama Randall S
Home Financials for this Owner
Home Financials are based on the most recent Mortgage that was taken out on this home.
Original Mortgage
$393,750
Outstanding Balance
$314,384
Interest Rate
2.99%
Mortgage Type
Adjustable Rate Mortgage/ARM
Estimated Equity
$583,975
Purchase Details
Closed on
Feb 27, 2015
Sold by
Bellama Don C and Bellama Jo Ann
Bought by
Don C & Jo Ann Bellama Declaration Of Tr and Bellama Jo Ann
Purchase Details
Closed on
Aug 28, 2012
Sold by
Corona Frank A and Corona Lourdes V
Bought by
Bellama Don and Bellama Joann
Home Financials for this Owner
Home Financials are based on the most recent Mortgage that was taken out on this home.
Original Mortgage
$219,000
Interest Rate
3.59%
Mortgage Type
New Conventional
Purchase Details
Closed on
May 13, 2004
Sold by
Robinson Charles and Robinson Susy
Bought by
Corona Frank A and Corona Lourdes
Home Financials for this Owner
Home Financials are based on the most recent Mortgage that was taken out on this home.
Original Mortgage
$387,900
Interest Rate
6.09%
Mortgage Type
Purchase Money Mortgage
Purchase Details
Closed on
Apr 14, 2003
Sold by
Geasland David R and Geasland Julie A
Bought by
Robinson Charles and Robinson Susy
Home Financials for this Owner
Home Financials are based on the most recent Mortgage that was taken out on this home.
Original Mortgage
$288,000
Interest Rate
5.72%
Purchase Details
Closed on
Feb 24, 1996
Sold by
Nowak Robert W and Nowak Janet
Bought by
Geasland David R and Geasland Julie A
Home Financials for this Owner
Home Financials are based on the most recent Mortgage that was taken out on this home.
Original Mortgage
$183,340
Interest Rate
7.41%
Mortgage Type
VA
Purchase Details
Closed on
Sep 6, 1989
Purchase Details
Closed on
Jun 8, 1987
Create a Home Valuation Report for This Property
The Home Valuation Report is an in-depth analysis detailing your home's value as well as a comparison with similar homes in the area
Home Values in the Area
Average Home Value in this Area
Purchase History
| Date | Buyer | Sale Price | Title Company |
|---|---|---|---|
| Garza Rafael | $525,000 | Equity Title San Diego | |
| Bellama Randall S | -- | None Available | |
| Don C & Jo Ann Bellama Declaration Of Tr | -- | None Available | |
| Bellama Don C | -- | None Available | |
| Bellama Don | $340,000 | First American Title | |
| Corona Frank A | $540,000 | Southland Title Corporation | |
| Robinson Charles | $370,000 | Lawyers Title | |
| Geasland David R | $178,000 | Southland Title Corporation | |
| Nowak Robert W | -- | Southland Title Corporation | |
| -- | $175,000 | -- | |
| -- | $122,000 | -- |
Source: Public Records
Mortgage History
| Date | Status | Borrower | Loan Amount |
|---|---|---|---|
| Open | Garza Rafael | $393,750 | |
| Previous Owner | Bellama Don | $219,000 | |
| Previous Owner | Corona Frank A | $387,900 | |
| Previous Owner | Robinson Charles | $288,000 | |
| Previous Owner | Geasland David R | $183,340 | |
| Closed | Robinson Charles | $32,000 | |
| Closed | Corona Frank A | $96,900 |
Source: Public Records
Tax History Compared to Growth
Tax History
| Year | Tax Paid | Tax Assessment Tax Assessment Total Assessment is a certain percentage of the fair market value that is determined by local assessors to be the total taxable value of land and additions on the property. | Land | Improvement |
|---|---|---|---|---|
| 2025 | $6,944 | $609,298 | $227,694 | $381,604 |
| 2024 | $6,944 | $597,352 | $223,230 | $374,122 |
| 2023 | $6,849 | $585,640 | $218,853 | $366,787 |
| 2022 | $6,651 | $574,158 | $214,562 | $359,596 |
| 2021 | $6,496 | $562,901 | $210,355 | $352,546 |
| 2020 | $6,340 | $557,131 | $208,199 | $348,932 |
| 2019 | $6,175 | $546,208 | $204,117 | $342,091 |
| 2018 | $6,078 | $535,499 | $200,115 | $335,384 |
| 2017 | $13 | $253,900 | $94,882 | $159,018 |
| 2016 | $2,869 | $248,922 | $93,022 | $155,900 |
| 2015 | $2,749 | $245,184 | $91,625 | $153,559 |
| 2014 | $2,702 | $240,382 | $89,831 | $150,551 |
Source: Public Records
Map
Nearby Homes
- 1654 Yale St
- 1665 Yale St
- 1579 Apache Dr Unit E
- 1567 Apache Dr Unit A
- 731 Baylor Ave
- 1761 Harvard St
- 1529 Apache Dr Unit A
- 1532 Apache Dr Unit D
- 1626 Coolsprings Ct
- 1633 Quailsprings Ct
- 1415 Summit Dr
- 1153 Gustine St
- 1386 Serena Cir Unit 2
- 1733 Mendota St
- 1925 Otay Lakes Rd Unit 69
- 1925 Otay Lakes Rd Unit 43
- 1925 Otay Lakes Rd Unit 167
- 1370 Callejon Palacios Unit 61
- 678 Rue Avallon
- 1781 Camino Strava Unit 1
- 1630 Elmhurst St
- 1622 Elmhurst St
- 1625 Yale St
- 1629 Yale St
- 1634 Elmhurst St
- 1618 Elmhurst St
- 1621 Yale St
- 1633 Yale St
- 1625 Elmhurst St
- 1629 Elmhurst St
- 1621 Elmhurst St
- 1638 Elmhurst St
- 1633 Elmhurst St
- 1614 Elmhurst St
- 1637 Yale St
- 1617 Yale St
- 1619 Elmhurst St
- 858 Auburn Ave
- 1626 Yale St
- 1622 Yale St