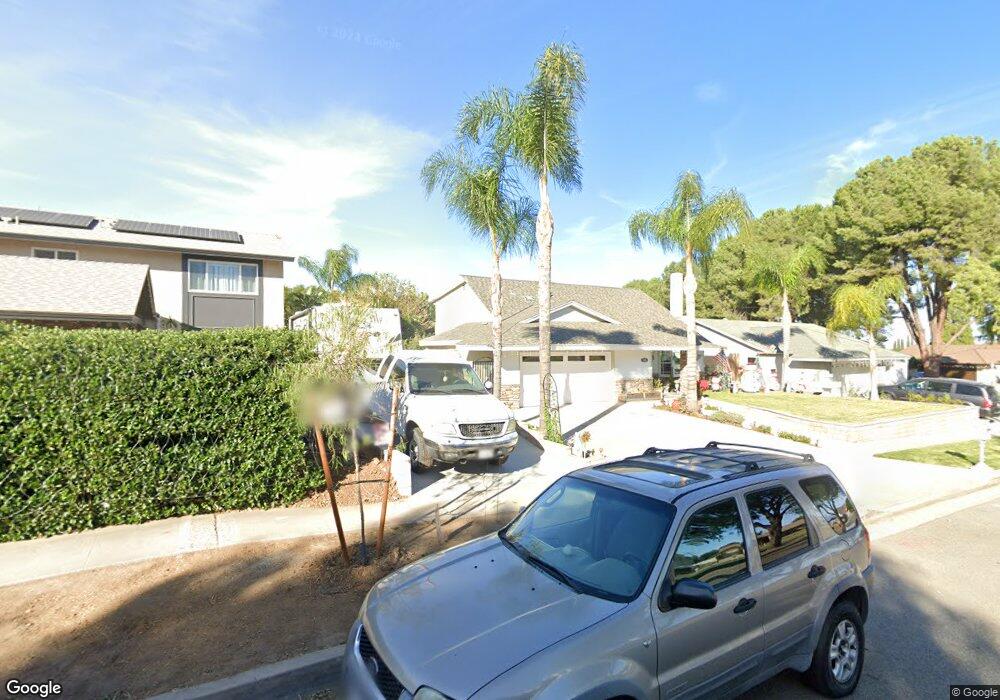
1626 Lilac St Corona, CA 92882
Central Corona NeighborhoodEstimated Value: $751,174 - $805,000
4
Beds
3
Baths
1,876
Sq Ft
$415/Sq Ft
Est. Value
About This Home
This home is located at 1626 Lilac St, Corona, CA 92882 and is currently estimated at $778,044, approximately $414 per square foot. 1626 Lilac St is a home located in Riverside County with nearby schools including Vicentia Elementary School, Letha Raney Intermediate School, and Corona High School.
Ownership History
Date
Name
Owned For
Owner Type
Purchase Details
Closed on
Aug 12, 2003
Sold by
Mccormick Michael R
Bought by
Mccormick Michael R and Houchins Sheila K
Current Estimated Value
Home Financials for this Owner
Home Financials are based on the most recent Mortgage that was taken out on this home.
Original Mortgage
$238,400
Outstanding Balance
$103,758
Interest Rate
5.46%
Mortgage Type
Purchase Money Mortgage
Estimated Equity
$674,286
Purchase Details
Closed on
Jun 2, 1998
Sold by
Federal National Mortgage Association
Bought by
Mccormick Michael R and Houchine Sheila K
Home Financials for this Owner
Home Financials are based on the most recent Mortgage that was taken out on this home.
Original Mortgage
$123,400
Interest Rate
7.03%
Mortgage Type
Seller Take Back
Purchase Details
Closed on
Mar 3, 1998
Sold by
Nationsbanc Mtg Corp
Bought by
Federal National Mortgage Association
Purchase Details
Closed on
Feb 17, 1998
Sold by
Michael Negrete and Negrete Donna G
Bought by
Nationsbanc Mtg Corp
Create a Home Valuation Report for This Property
The Home Valuation Report is an in-depth analysis detailing your home's value as well as a comparison with similar homes in the area
Home Values in the Area
Average Home Value in this Area
Purchase History
| Date | Buyer | Sale Price | Title Company |
|---|---|---|---|
| Mccormick Michael R | -- | -- | |
| Mccormick Michael R | -- | Commerce Title Company | |
| Mccormick Michael R | $130,000 | Commonwealth Land Title Co | |
| Federal National Mortgage Association | -- | Chicago Title Co | |
| Nationsbanc Mtg Corp | $136,897 | Chicago Title Co |
Source: Public Records
Mortgage History
| Date | Status | Borrower | Loan Amount |
|---|---|---|---|
| Open | Mccormick Michael R | $238,400 | |
| Previous Owner | Mccormick Michael R | $123,400 |
Source: Public Records
Tax History
| Year | Tax Paid | Tax Assessment Tax Assessment Total Assessment is a certain percentage of the fair market value that is determined by local assessors to be the total taxable value of land and additions on the property. | Land | Improvement |
|---|---|---|---|---|
| 2025 | $2,904 | $268,304 | $99,238 | $169,066 |
| 2023 | $2,904 | $257,887 | $95,386 | $162,501 |
| 2022 | $2,810 | $252,831 | $93,516 | $159,315 |
| 2021 | $2,753 | $247,875 | $91,683 | $156,192 |
| 2020 | $2,723 | $245,334 | $90,743 | $154,591 |
| 2019 | $2,659 | $240,524 | $88,964 | $151,560 |
| 2018 | $2,598 | $235,809 | $87,221 | $148,588 |
| 2017 | $2,534 | $231,186 | $85,511 | $145,675 |
| 2016 | $2,508 | $226,654 | $83,835 | $142,819 |
| 2015 | $2,453 | $223,252 | $82,577 | $140,675 |
| 2014 | $2,364 | $218,880 | $80,960 | $137,920 |
Source: Public Records
Map
Nearby Homes
- 1127 Via Santiago
- 1077 Westpark Ln
- 2024 Peony St
- 1029 Westpark Ln
- 924 Lorna St
- 946 W Kendall St
- 951 W Kendall St
- 1307 Via Santiago Unit B
- 853 W Crestview St
- 1315 Via Santiago Unit A
- 1382 Via Santiago
- 927 Alta Loma Dr
- 1078 Border Ave
- 1221 W 10th St
- 1387 Thornwood Square
- 991 Norwich Way
- 1383 Thornwood Square
- 1305 Brentwood Cir Unit D
- 1327 Woodbrook Way
- 1320 Brentwood Cir Unit B
- 1650 Lilac St
- 1608 Lilac St
- 1629 Zinnia St
- 1617 Zinnia St
- 1672 Lilac St
- 1641 Zinnia St
- 1130 Via Santiago
- 1605 Zinnia St
- 1653 Zinnia St
- 1694 Lilac St
- 1135 Via Santiago
- 1139 Via Santiago
- 1131 Iris Cir
- 1126 Via Santiago
- 1131 Via Santiago
- 1143 Via Santiago
- 1665 Zinnia St
- 1626 Zinnia St
- 1638 Zinnia St
- 1730 Lilac St
Your Personal Tour Guide
Ask me questions while you tour the home.