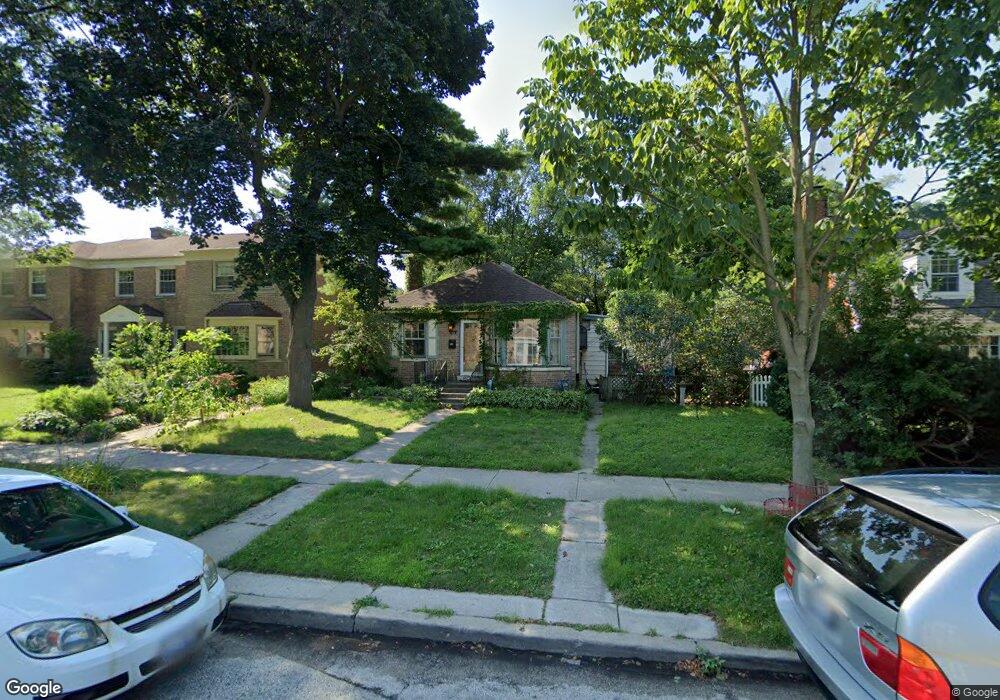
1626 Madison St Evanston, IL 60202
Southwest Evanston NeighborhoodEstimated Value: $424,000 - $590,000
2
Beds
1
Bath
1,144
Sq Ft
$430/Sq Ft
Est. Value
About This Home
This home is located at 1626 Madison St, Evanston, IL 60202 and is currently estimated at $491,901, approximately $429 per square foot. 1626 Madison St is a home located in Cook County with nearby schools including Nichols Middle School, Evanston Township High School, and Pope John XXIII School.
Ownership History
Date
Name
Owned For
Owner Type
Purchase Details
Closed on
Sep 15, 2006
Sold by
Reyes Laura
Bought by
Kerste Matthew S
Current Estimated Value
Home Financials for this Owner
Home Financials are based on the most recent Mortgage that was taken out on this home.
Original Mortgage
$309,000
Outstanding Balance
$181,870
Interest Rate
6.59%
Mortgage Type
Unknown
Estimated Equity
$310,031
Purchase Details
Closed on
Sep 9, 2002
Sold by
Zgarrick Mark
Bought by
Reyes Laura
Home Financials for this Owner
Home Financials are based on the most recent Mortgage that was taken out on this home.
Original Mortgage
$172,000
Interest Rate
6.87%
Mortgage Type
Unknown
Purchase Details
Closed on
Jun 18, 1999
Sold by
Drummer Earl W and Enos Drummer Barbara J
Bought by
Zgarrick Mark and Reyes Laura
Home Financials for this Owner
Home Financials are based on the most recent Mortgage that was taken out on this home.
Original Mortgage
$179,000
Interest Rate
7.15%
Create a Home Valuation Report for This Property
The Home Valuation Report is an in-depth analysis detailing your home's value as well as a comparison with similar homes in the area
Home Values in the Area
Average Home Value in this Area
Purchase History
| Date | Buyer | Sale Price | Title Company |
|---|---|---|---|
| Kerste Matthew S | $350,000 | Cti | |
| Reyes Laura | -- | Rei Title | |
| Reyes Laura | -- | Rei Title | |
| Zgarrick Mark | $199,000 | -- |
Source: Public Records
Mortgage History
| Date | Status | Borrower | Loan Amount |
|---|---|---|---|
| Open | Kerste Matthew S | $309,000 | |
| Previous Owner | Reyes Laura | $172,000 | |
| Previous Owner | Zgarrick Mark | $179,000 |
Source: Public Records
Tax History
| Year | Tax Paid | Tax Assessment Tax Assessment Total Assessment is a certain percentage of the fair market value that is determined by local assessors to be the total taxable value of land and additions on the property. | Land | Improvement |
|---|---|---|---|---|
| 2025 | $7,550 | $44,000 | $12,090 | $31,910 |
| 2024 | $7,550 | $34,094 | $10,230 | $23,864 |
| 2023 | $7,492 | $35,261 | $10,230 | $25,031 |
| 2022 | $7,492 | $35,261 | $10,230 | $25,031 |
| 2021 | $6,394 | $27,106 | $7,440 | $19,666 |
| 2020 | $6,368 | $27,106 | $7,440 | $19,666 |
| 2019 | $6,375 | $30,287 | $7,440 | $22,847 |
| 2018 | $5,373 | $22,788 | $6,200 | $16,588 |
| 2017 | $5,714 | $24,515 | $6,200 | $18,315 |
| 2016 | $6,651 | $28,445 | $6,200 | $22,245 |
| 2015 | $5,348 | $22,290 | $5,115 | $17,175 |
| 2014 | $5,312 | $22,290 | $5,115 | $17,175 |
| 2013 | $5,173 | $22,290 | $5,115 | $17,175 |
Source: Public Records
Map
Nearby Homes
- 704 Florence Ave
- 1815 Cleveland St
- 1810 Washington St
- 1507 Cleveland St
- 1520 Washington St
- 1736 Keeney St
- 826 Brown Ave
- 920 Dodge Ave
- 1314 Main St Unit 2D
- 1315 Main St
- SAN JUAN GRANDE La Cascabela
- 1003 Wesley Ave
- 1042 Dewey Ave
- 1037 Dodge Ave
- 1025 Wesley Ave
- 835 Ridge Ave Unit 103
- 1217 Hull Terrace Unit 3A
- 1133 Dodge Ave
- 921 Madison St
- 1104 Austin St
- 1624 Madison St
- 1630 Madison St
- 1622 Madison St
- 1620 Madison St
- 1700 Madison St
- 1616 Madison St
- 1627 Monroe St
- 1627 Monroe St Unit 1
- 1614 Madison St
- 1631 Monroe St Unit 2-3
- 1631 Monroe St Unit 1-3
- 1631 Monroe St Unit 1
- 1631 Monroe St Unit 3
- 1621 Monroe St
- 1629 Monroe St
- 1619 Monroe St Unit 1
- 1619 Monroe St Unit 2
- 1619 Monroe St
- 1612 Madison St
- 1631 Madison St
Your Personal Tour Guide
Ask me questions while you tour the home.