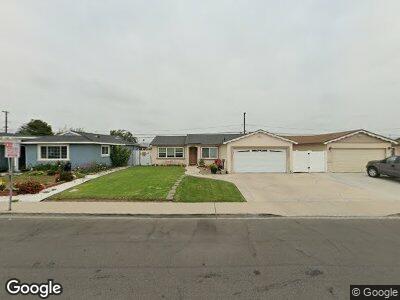
1626 N 6th Place Port Hueneme, CA 93041
Estimated Value: $663,000 - $703,000
3
Beds
2
Baths
1,046
Sq Ft
$647/Sq Ft
Est. Value
About This Home
This home is located at 1626 N 6th Place, Port Hueneme, CA 93041 and is currently estimated at $676,993, approximately $647 per square foot. 1626 N 6th Place is a home located in Ventura County with nearby schools including Parkview Elementary, Hueneme High School, and St. Anthony's Elementary School.
Ownership History
Date
Name
Owned For
Owner Type
Purchase Details
Closed on
Mar 8, 2019
Sold by
Williams Meza Rebecca L and Williams Rebecca L
Bought by
Williams Meza Rebecca L and Meza Trinidad A
Current Estimated Value
Home Financials for this Owner
Home Financials are based on the most recent Mortgage that was taken out on this home.
Original Mortgage
$170,000
Outstanding Balance
$153,013
Interest Rate
4.4%
Mortgage Type
New Conventional
Purchase Details
Closed on
Feb 19, 1998
Sold by
Saindon Linda B and Saindon William G
Bought by
Williams Rebecca L
Home Financials for this Owner
Home Financials are based on the most recent Mortgage that was taken out on this home.
Original Mortgage
$133,334
Interest Rate
7.02%
Mortgage Type
FHA
Create a Home Valuation Report for This Property
The Home Valuation Report is an in-depth analysis detailing your home's value as well as a comparison with similar homes in the area
Home Values in the Area
Average Home Value in this Area
Purchase History
| Date | Buyer | Sale Price | Title Company |
|---|---|---|---|
| Williams Meza Rebecca L | -- | Wfg National Title Co Of Ca | |
| Williams Rebecca L | $135,000 | First American Title Ins Co |
Source: Public Records
Mortgage History
| Date | Status | Borrower | Loan Amount |
|---|---|---|---|
| Open | Williams Meza Rebecca L | $170,000 | |
| Closed | Williams Rebecca L | $179,000 | |
| Closed | Meza Rebecca L Williams | $50,000 | |
| Closed | Williams Rebecca L | $131,750 | |
| Closed | Williams Rebecca L | $133,334 |
Source: Public Records
Tax History Compared to Growth
Tax History
| Year | Tax Paid | Tax Assessment Tax Assessment Total Assessment is a certain percentage of the fair market value that is determined by local assessors to be the total taxable value of land and additions on the property. | Land | Improvement |
|---|---|---|---|---|
| 2024 | $2,563 | $211,289 | $84,513 | $126,776 |
| 2023 | $2,439 | $207,147 | $82,856 | $124,291 |
| 2022 | $2,371 | $203,086 | $81,232 | $121,854 |
| 2021 | $2,369 | $199,104 | $79,639 | $119,465 |
| 2020 | $2,340 | $197,064 | $78,823 | $118,241 |
| 2019 | $2,307 | $193,201 | $77,278 | $115,923 |
| 2018 | $2,233 | $189,413 | $75,763 | $113,650 |
| 2017 | $2,153 | $185,700 | $74,278 | $111,422 |
| 2016 | $2,090 | $182,060 | $72,822 | $109,238 |
| 2015 | $2,038 | $179,328 | $71,729 | $107,599 |
| 2014 | $2,018 | $175,818 | $70,325 | $105,493 |
Source: Public Records
Map
Nearby Homes
- 1712 N 7th Place
- 1502 Park Ave
- 3911 S G St
- 929 Bryce Canyon Ave
- 833 Bryce Canyon Ave
- 915 Maplewood Way
- 4117 S C St
- 4905 S J St
- 1319 W Poplar St
- 210 E Pleasant Valley Rd
- 3805 Samuel Dr Unit 183
- 451 Redwood St
- 140 Borrego Ave Unit 174
- 0 Saviers Rd
- 309 W Rosa St
- 507 Batten Ln
- 265 Gaviota Place Unit SP147
- 535 Starboard Ln
- 129 E B St
- 4105 Bradfield Dr Unit 55
- 1626 N 6th Place
- 1636 N 6th Place
- 1616 N 6th Place
- 1623 N 7th St
- 1646 N 6th Place
- 1606 N 6th Place
- 1633 N 7th St
- 1613 N 7th St
- 1643 N 7th St
- 1603 N 7th St
- 1576 N 6th Place
- 1625 N 6th Place
- 1635 N 6th Place
- 1615 N 6th Place
- 1656 N 6th Place
- 1573 N 7th St
- 1645 N 6th Place
- 1605 N 6th Place
- 1653 N 7th St
- 1566 N 6th Place