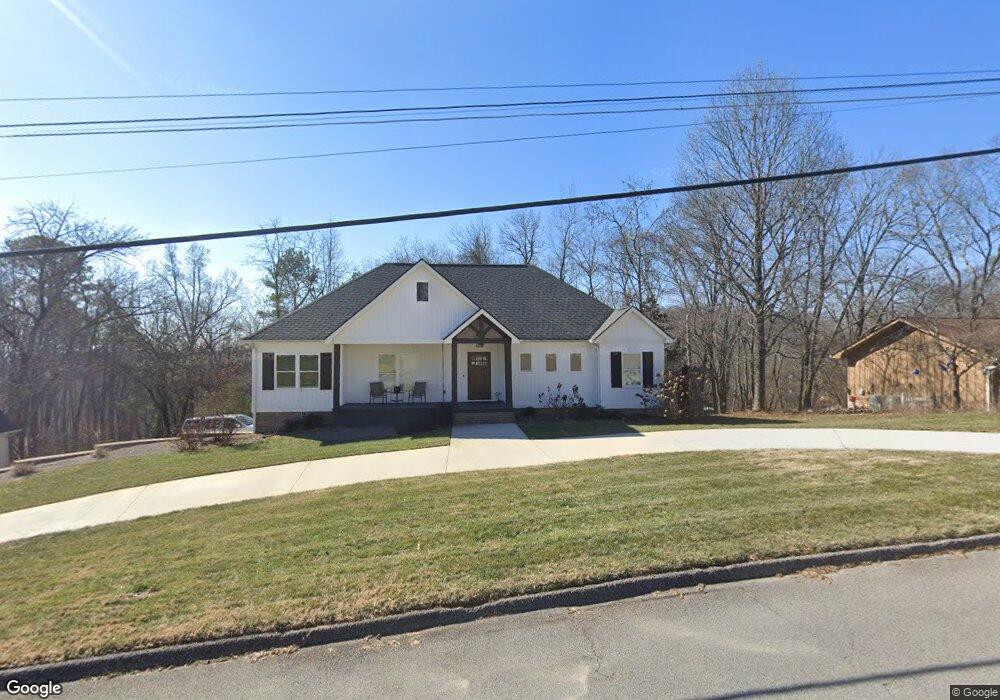
1626 Rock Bluff Rd Unit 232 Hixson, TN 37343
Estimated Value: $472,000 - $505,967
--
Bed
--
Bath
2,566
Sq Ft
$193/Sq Ft
Est. Value
About This Home
This home is located at 1626 Rock Bluff Rd Unit 232, Hixson, TN 37343 and is currently estimated at $495,242, approximately $193 per square foot. 1626 Rock Bluff Rd Unit 232 is a home located in Hamilton County with nearby schools including McConnell Elementary School, Loftis Middle School, and Hixson High School.
Ownership History
Date
Name
Owned For
Owner Type
Purchase Details
Closed on
May 7, 2021
Sold by
Bowman Jason D and Bowman Lyndsey
Bought by
Slisko Jennifer and Slisko Igor
Current Estimated Value
Home Financials for this Owner
Home Financials are based on the most recent Mortgage that was taken out on this home.
Original Mortgage
$356,250
Outstanding Balance
$322,851
Interest Rate
3.1%
Mortgage Type
New Conventional
Estimated Equity
$172,391
Purchase Details
Closed on
Aug 3, 2020
Sold by
Bowman Jason D
Bought by
Bowman Lyndsey
Home Financials for this Owner
Home Financials are based on the most recent Mortgage that was taken out on this home.
Original Mortgage
$242,450
Interest Rate
3.1%
Mortgage Type
Commercial
Purchase Details
Closed on
Jun 21, 2019
Sold by
Anglin Betty W and Anglin Roy W
Bought by
Bowman Jason D
Create a Home Valuation Report for This Property
The Home Valuation Report is an in-depth analysis detailing your home's value as well as a comparison with similar homes in the area
Home Values in the Area
Average Home Value in this Area
Purchase History
| Date | Buyer | Sale Price | Title Company |
|---|---|---|---|
| Slisko Jennifer | $375,000 | None Available | |
| Bowman Lyndsey | -- | Title Guaranty & Trust Co | |
| Bowman Jason D | $40,000 | Chattanooga Ttl East Brainer |
Source: Public Records
Mortgage History
| Date | Status | Borrower | Loan Amount |
|---|---|---|---|
| Open | Slisko Jennifer | $356,250 | |
| Previous Owner | Bowman Lyndsey | $242,450 |
Source: Public Records
Tax History Compared to Growth
Tax History
| Year | Tax Paid | Tax Assessment Tax Assessment Total Assessment is a certain percentage of the fair market value that is determined by local assessors to be the total taxable value of land and additions on the property. | Land | Improvement |
|---|---|---|---|---|
| 2024 | $2,007 | $89,725 | $0 | $0 |
| 2023 | $2,016 | $89,725 | $0 | $0 |
| 2022 | $2,016 | $89,725 | $0 | $0 |
| 2021 | $1,261 | $55,975 | $0 | $0 |
| 2020 | $239 | $8,625 | $0 | $0 |
| 2019 | $239 | $8,625 | $0 | $0 |
| 2018 | $1,302 | $46,750 | $0 | $0 |
| 2017 | $1,302 | $46,750 | $0 | $0 |
| 2016 | $1,143 | $0 | $0 | $0 |
| 2015 | $1,143 | $41,000 | $0 | $0 |
| 2014 | $1,143 | $0 | $0 | $0 |
Source: Public Records
Map
Nearby Homes
- 1706 Mountain Bay Dr
- 1800 Mountain Bay Dr
- 6577 Fairview Rd
- 1705 Sea Gull Ln
- 1820 Rock Bluff Rd
- Hamilton Plan at The Farmstead - Courtyard Homes
- Delaney Plan at The Farmstead - Courtyard Homes
- Lincoln Plan at The Farmstead - Courtyard Homes
- Cumberland Plan at The Farmstead - Courtyard Homes
- Everwood Plan at The Farmstead - Backyard Homes
- Oxford Plan at The Farmstead - Backyard Homes
- Yosemite Plan at The Farmstead - Backyard Homes
- Roosevelt Plan at The Farmstead - Backyard Homes
- Adele Plan at The Farmstead - Courtyard Homes
- Camden Plan at The Farmstead - Backyard Homes
- River Plan at The Farmstead - Backyard Homes
- Arlington Plan at The Farmstead - Backyard Homes
- Phoenix Plan at The Farmstead - Courtyard Homes
- Redwood Plan at The Farmstead - Backyard Homes
- Hunter Plan at The Farmstead - Backyard Homes
- 1626 Rock Bluff Rd
- 1624 Rock Bluff Rd
- 1630 Rock Bluff Rd
- 1625 Rock Bluff Rd
- 1629 Rock Bluff Rd
- 1623 Rock Bluff Rd
- 1631 Rock Bluff Rd
- 1631 Rock Bluff Rd Unit 232
- 1634 Rock Bluff Rd Unit 12
- 1635 Rock Bluff Rd
- 1619 Rock Bluff Rd
- 1616 Rock Bluff Rd Unit Lot 31
- 1704 Mountain Bay Dr
- 1704 Mountain Bay Dr Unit 1232
- 1703 Rock Bluff Rd
- 1709 Rock Bluff Rd
- 0 Rock Bluff Rd
- 0 Rock Bluff Rd Unit 1311397
- 0 Rock Bluff Rd Unit 1274796
- 0 Rock Bluff Rd Unit RTC2729088