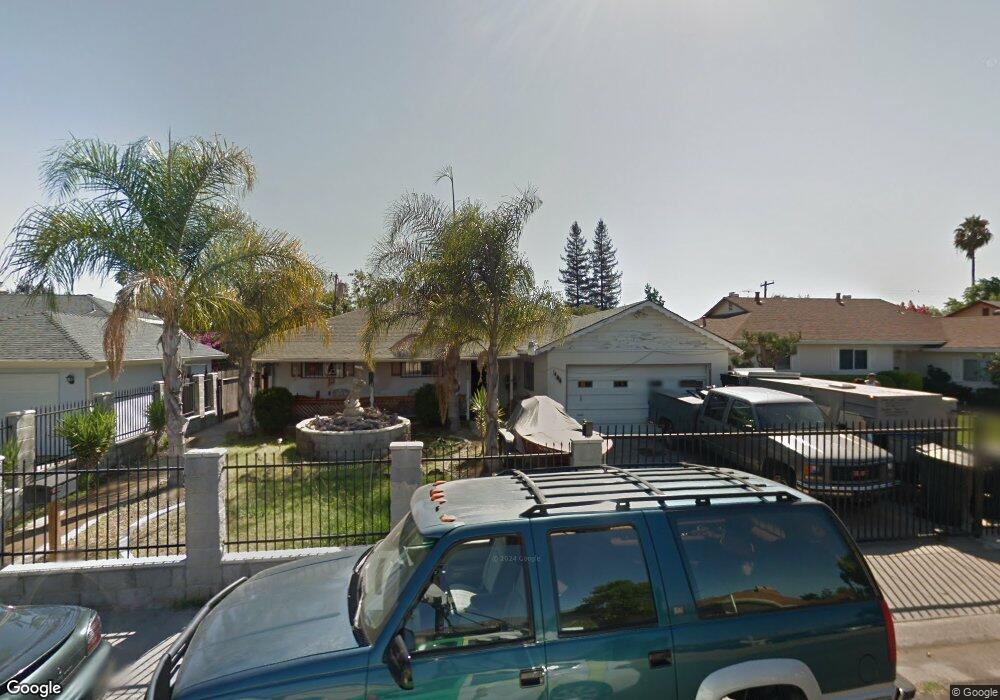
1626 Wakefield Way Sacramento, CA 95822
Meadowview NeighborhoodEstimated Value: $394,000 - $413,000
3
Beds
2
Baths
1,397
Sq Ft
$290/Sq Ft
Est. Value
About This Home
This home is located at 1626 Wakefield Way, Sacramento, CA 95822 and is currently estimated at $405,343, approximately $290 per square foot. 1626 Wakefield Way is a home located in Sacramento County with nearby schools including John Bidwell Elementary School, Rosa Parks Elementary School, and John F. Kennedy High School.
Ownership History
Date
Name
Owned For
Owner Type
Purchase Details
Closed on
Feb 10, 2003
Sold by
Moseley Eva Grace
Bought by
Moseley Anthony Craig
Current Estimated Value
Home Financials for this Owner
Home Financials are based on the most recent Mortgage that was taken out on this home.
Original Mortgage
$88,500
Outstanding Balance
$44,150
Interest Rate
8.25%
Estimated Equity
$361,193
Purchase Details
Closed on
Dec 18, 2002
Sold by
Moseley Eva Grace
Bought by
Moseley Anthony Craig
Home Financials for this Owner
Home Financials are based on the most recent Mortgage that was taken out on this home.
Original Mortgage
$88,500
Outstanding Balance
$44,150
Interest Rate
8.25%
Estimated Equity
$361,193
Purchase Details
Closed on
Dec 24, 2001
Sold by
Moseley Anthony Craig
Bought by
Moseley I Anthony Craig
Purchase Details
Closed on
Aug 23, 2000
Sold by
Moseley Eva G
Bought by
Moseley Anthony Craig
Create a Home Valuation Report for This Property
The Home Valuation Report is an in-depth analysis detailing your home's value as well as a comparison with similar homes in the area
Home Values in the Area
Average Home Value in this Area
Purchase History
| Date | Buyer | Sale Price | Title Company |
|---|---|---|---|
| Moseley Anthony Craig | -- | -- | |
| Moseley Anthony Craig | -- | -- | |
| Moseley I Anthony Craig | -- | -- | |
| Moseley Anthony Craig | -- | -- |
Source: Public Records
Mortgage History
| Date | Status | Borrower | Loan Amount |
|---|---|---|---|
| Open | Moseley Anthony Craig | $88,500 |
Source: Public Records
Tax History Compared to Growth
Tax History
| Year | Tax Paid | Tax Assessment Tax Assessment Total Assessment is a certain percentage of the fair market value that is determined by local assessors to be the total taxable value of land and additions on the property. | Land | Improvement |
|---|---|---|---|---|
| 2025 | $911 | $51,409 | $9,770 | $41,639 |
| 2024 | $911 | $50,402 | $9,579 | $40,823 |
| 2023 | $883 | $49,415 | $9,392 | $40,023 |
| 2022 | $882 | $48,447 | $9,208 | $39,239 |
| 2021 | $840 | $47,498 | $9,028 | $38,470 |
| 2020 | $836 | $47,012 | $8,936 | $38,076 |
| 2019 | $820 | $46,091 | $8,761 | $37,330 |
| 2018 | $800 | $45,189 | $8,590 | $36,599 |
| 2017 | $784 | $44,304 | $8,422 | $35,882 |
| 2016 | $703 | $43,436 | $8,257 | $35,179 |
| 2015 | $677 | $42,784 | $8,133 | $34,651 |
| 2014 | $2,757 | $41,947 | $7,974 | $33,973 |
Source: Public Records
Map
Nearby Homes
- 7284 Cromwell Way
- 1449 64th Ave
- 1716 68th Ave
- 1416 Lomas Way
- 7341 Stanwood Way
- 7332 Idle Wild Way
- 1312 58th Ave
- 7400 Mooncrest Way
- 2121 Aaron Way
- 2154 63rd Ave
- 6877 Buena Terra Way
- 7048 13th St
- 7524 Schreiner St
- 2121 Oneil Way
- 7036 13th St
- 7518 Bowen Cir
- 7036 Remo Way
- 6921 Diegel Cir
- 7536 Cosgrove Way
- 7580 19th St
- 1632 Wakefield Way
- 1620 Wakefield Way
- 7248 Milford St
- 1638 Wakefield Way
- 1614 Wakefield Way
- 7240 Milford St
- 7256 Milford St
- 1627 Wakefield Way
- 7232 Milford St
- 7264 Milford St
- 1633 Wakefield Way
- 1621 Wakefield Way
- 1608 Wakefield Way
- 1644 Wakefield Way
- 1639 Wakefield Way
- 1615 Wakefield Way
- 7268 Milford St
- 7224 Milford St
- 1609 Wakefield Way
- 1600 Wakefield Way