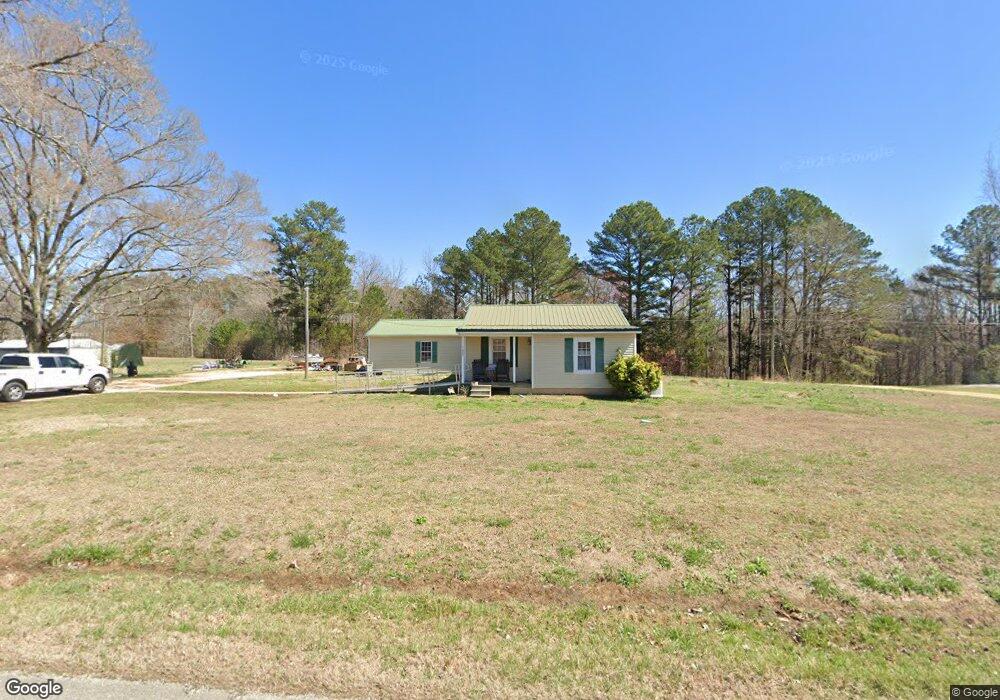
1627 Wilkinstown Rd Parsons, TN 38363
Estimated Value: $157,944 - $230,000
3
Beds
2
Baths
1,702
Sq Ft
$107/Sq Ft
Est. Value
About This Home
This home is located at 1627 Wilkinstown Rd, Parsons, TN 38363 and is currently estimated at $182,236, approximately $107 per square foot. 1627 Wilkinstown Rd is a home located in Decatur County with nearby schools including Parsons Elementary School, Decaturville Elementary School, and Decatur County Middle School.
Ownership History
Date
Name
Owned For
Owner Type
Purchase Details
Closed on
Jun 11, 2013
Sold by
Federal National Mortgage Association
Bought by
Ward Thomas H and Ward Shawna M
Current Estimated Value
Home Financials for this Owner
Home Financials are based on the most recent Mortgage that was taken out on this home.
Original Mortgage
$71,700
Outstanding Balance
$50,670
Interest Rate
3.42%
Mortgage Type
Cash
Estimated Equity
$131,566
Purchase Details
Closed on
Feb 27, 2013
Sold by
Blankenship Christy
Bought by
Federal National Mtg Associati and O Fannie Mae C
Purchase Details
Closed on
Sep 21, 2007
Sold by
Cupples Lendal
Bought by
Blankenship Christy
Purchase Details
Closed on
Nov 10, 2006
Sold by
Blankenship Christy
Bought by
Cupples Lendal
Purchase Details
Closed on
Oct 5, 2006
Sold by
Wheat Paul E
Bought by
Blankenship Christy
Purchase Details
Closed on
Jan 6, 2002
Bought by
Wheat Paul E and Wheat Cindy
Purchase Details
Closed on
Dec 30, 1974
Purchase Details
Closed on
Dec 30, 1968
Create a Home Valuation Report for This Property
The Home Valuation Report is an in-depth analysis detailing your home's value as well as a comparison with similar homes in the area
Home Values in the Area
Average Home Value in this Area
Purchase History
| Date | Buyer | Sale Price | Title Company |
|---|---|---|---|
| Ward Thomas H | $65,000 | -- | |
| Federal National Mtg Associati | $109,545 | -- | |
| Blankenship Christy | -- | -- | |
| Cupples Lendal | -- | -- | |
| Blankenship Christy | $12,000 | -- | |
| Wheat Paul E | $30,000 | -- | |
| -- | -- | -- | |
| -- | -- | -- |
Source: Public Records
Mortgage History
| Date | Status | Borrower | Loan Amount |
|---|---|---|---|
| Open | Ward Thomas H | $71,700 |
Source: Public Records
Tax History Compared to Growth
Tax History
| Year | Tax Paid | Tax Assessment Tax Assessment Total Assessment is a certain percentage of the fair market value that is determined by local assessors to be the total taxable value of land and additions on the property. | Land | Improvement |
|---|---|---|---|---|
| 2025 | $639 | $45,075 | $0 | $0 |
| 2024 | $639 | $24,775 | $1,625 | $23,150 |
| 2023 | $639 | $24,775 | $1,625 | $23,150 |
| 2022 | $639 | $24,775 | $1,625 | $23,150 |
| 2021 | $640 | $24,775 | $1,625 | $23,150 |
| 2020 | $640 | $24,800 | $1,625 | $23,175 |
| 2019 | $577 | $25,625 | $1,650 | $23,975 |
| 2018 | $510 | $25,625 | $1,650 | $23,975 |
| 2017 | $510 | $25,625 | $1,650 | $23,975 |
| 2016 | $510 | $25,625 | $1,650 | $23,975 |
| 2015 | $510 | $25,625 | $1,650 | $23,975 |
| 2014 | $510 | $25,609 | $0 | $0 |
Source: Public Records
Map
Nearby Homes
- 1585 Wilkinstown Rd
- 1647 Wilkinstown Rd
- 1455 Wilkinstown Rd
- 1710 Wilkinstown Rd
- 1445 Wilkinstown Rd
- 1950 Wilkinstown Rd
- 1474 Wilkinstown Rd
- 1510 Wilkinstown Rd
- 1439 Wilkinstown Rd
- 1606 Wilkinstown Rd
- 1801 Wilkinstown Rd
- 1410 Wilkinstown Rd
- 1405 Wilkinstown Rd
- 1648 Wilkinstown Rd
- 189 Harry Turpen Ln
- 1339 Wilkinstown Rd
- 1926 Wilkinstown Rd
- 1268 Wilkinstown Rd
- 1156 Wilkinstown Rd
- 1155 Wilkinstown Rd