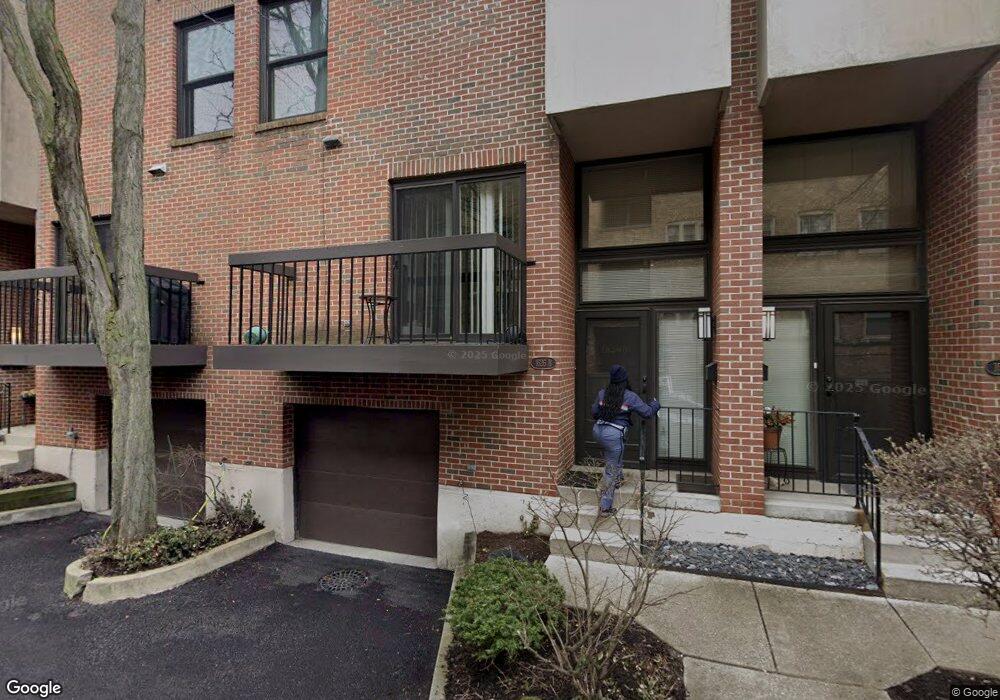
1628 Central St Unit B Evanston, IL 60201
Central Street NeighborhoodEstimated Value: $522,000 - $644,000
2
Beds
3
Baths
1,600
Sq Ft
$357/Sq Ft
Est. Value
About This Home
This home is located at 1628 Central St Unit B, Evanston, IL 60201 and is currently estimated at $571,016, approximately $356 per square foot. 1628 Central St Unit B is a home located in Cook County with nearby schools including Kingsley Elementary School, Haven Middle School, and Evanston Township High School.
Ownership History
Date
Name
Owned For
Owner Type
Purchase Details
Closed on
Apr 14, 2011
Sold by
Cole Dan P and Cole Catharine C
Bought by
Champlin Clay
Current Estimated Value
Home Financials for this Owner
Home Financials are based on the most recent Mortgage that was taken out on this home.
Original Mortgage
$230,000
Interest Rate
4.92%
Mortgage Type
Seller Take Back
Purchase Details
Closed on
Apr 28, 2006
Sold by
Galowich Pamela M
Bought by
Cole Dan P and Cole Catharine C
Purchase Details
Closed on
Dec 21, 2001
Sold by
Jaffee Eric and Jaffee Marvin N
Bought by
Galowich Pamela M
Home Financials for this Owner
Home Financials are based on the most recent Mortgage that was taken out on this home.
Original Mortgage
$100,000
Interest Rate
6.87%
Mortgage Type
Purchase Money Mortgage
Purchase Details
Closed on
Dec 23, 1995
Sold by
Jaffee Marvin N
Bought by
Jaffee Marvin N and Marvin Jaffee Revocable Trust
Create a Home Valuation Report for This Property
The Home Valuation Report is an in-depth analysis detailing your home's value as well as a comparison with similar homes in the area
Home Values in the Area
Average Home Value in this Area
Purchase History
| Date | Buyer | Sale Price | Title Company |
|---|---|---|---|
| Champlin Clay | $300,000 | None Available | |
| Cole Dan P | $400,000 | First American | |
| Galowich Pamela M | $299,000 | -- | |
| Jaffee Marvin N | -- | -- |
Source: Public Records
Mortgage History
| Date | Status | Borrower | Loan Amount |
|---|---|---|---|
| Closed | Champlin Clay | $230,000 | |
| Previous Owner | Galowich Pamela M | $100,000 |
Source: Public Records
Tax History Compared to Growth
Tax History
| Year | Tax Paid | Tax Assessment Tax Assessment Total Assessment is a certain percentage of the fair market value that is determined by local assessors to be the total taxable value of land and additions on the property. | Land | Improvement |
|---|---|---|---|---|
| 2024 | $8,939 | $40,239 | $4,344 | $35,895 |
| 2023 | $8,553 | $40,239 | $4,344 | $35,895 |
| 2022 | $8,553 | $40,239 | $4,344 | $35,895 |
| 2021 | $7,312 | $30,883 | $2,896 | $27,987 |
| 2020 | $7,274 | $30,883 | $2,896 | $27,987 |
| 2019 | $7,139 | $33,900 | $2,896 | $31,004 |
| 2018 | $7,590 | $31,140 | $2,413 | $28,727 |
| 2017 | $7,408 | $31,140 | $2,413 | $28,727 |
| 2016 | $7,249 | $31,140 | $2,413 | $28,727 |
| 2015 | $7,340 | $29,999 | $2,027 | $27,972 |
| 2014 | $7,285 | $29,999 | $2,027 | $27,972 |
| 2013 | $7,102 | $29,999 | $2,027 | $27,972 |
Source: Public Records
Map
Nearby Homes
- 2635 Poplar Ave
- 2741 Eastwood Ave
- 2539.5 Prairie Ave Unit 3W
- 1219 Central St Unit B
- 2015 Colfax St
- 2108 Harrison St
- 1915 Grant St
- 2020 Colfax St
- 105 Dupee Place
- 1910 Grant St
- 2135 Central St Unit 3W
- 1918 Noyes St
- 2017 Jackson Ave
- 2118 Jackson Ave
- 250 3rd St
- 2353 Ridge Ave
- 2236 Ridge Ave
- 2026 Green Bay Rd
- 2754 Ridge Ave
- 2005 Darrow Ave
- 1628 Central St Unit 1628B
- 1628 Central St Unit 1628A
- 1626 Central St Unit 1626A
- 1626 Central St Unit 1626C
- 1628 Central St Unit 1628C
- 1626 Central St Unit 1626B
- 1626 Central St Unit C
- 1628 Central St Unit A
- 1624 Central St Unit 1624C
- 1624 Central St Unit 1624B
- 1624 Central St Unit 1624A
- 1624 Central St Unit B
- 1606 Central St Unit 1606
- 1703 Harrison St
- 1701 Central St
- 2530 Ashland Ave
- 2526 Ashland Ave
- 1610 Central St Unit 1610
- 1608 Central St Unit 1608
- 1602 Central St Unit 1602