Estimated Value: $346,000 - $433,000
3
Beds
2
Baths
1,562
Sq Ft
$254/Sq Ft
Est. Value
About This Home
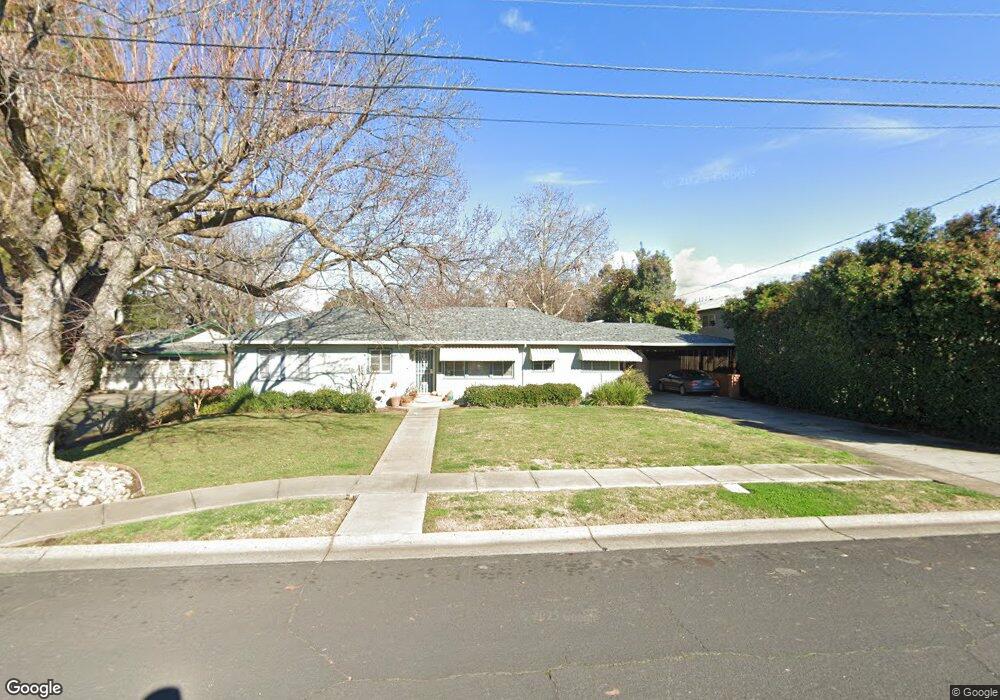
This home is located at 1628 Neal Dow Ave, Chico, CA 95926 and is currently estimated at $396,513, approximately $253 per square foot. 1628 Neal Dow Ave is a home located in Butte County with nearby schools including Neal Dow Elementary School, Bidwell Junior High School, and Pleasant Valley High School.
Ownership History
Date
Name
Owned For
Owner Type
Purchase Details
Closed on
Mar 25, 2013
Sold by
Hardin Richard D and Hardin Katharine L
Bought by
Hardin Richard D and Hardin Katharine L
Current Estimated Value
Purchase Details
Closed on
Oct 2, 2002
Sold by
Leonard Lisa
Bought by
Hardin Richard and Hardin Katharine
Purchase Details
Closed on
Jun 13, 2002
Sold by
Leonard Bradley B
Bought by
Leonard Lisa
Purchase Details
Closed on
Dec 21, 2001
Sold by
Bellin Ann M
Bought by
Balken Eric J and Balken Maci Rider
Home Financials for this Owner
Home Financials are based on the most recent Mortgage that was taken out on this home.
Original Mortgage
$191,250
Interest Rate
9.5%
Purchase Details
Closed on
Mar 29, 2001
Sold by
Bellin Ann Marie and The Robert V Bellin Marital Tr
Bought by
Bellin Ann M
Home Financials for this Owner
Home Financials are based on the most recent Mortgage that was taken out on this home.
Original Mortgage
$50,000
Interest Rate
7.06%
Mortgage Type
Stand Alone Second
Create a Home Valuation Report for This Property
The Home Valuation Report is an in-depth analysis detailing your home's value as well as a comparison with similar homes in the area
Home Values in the Area
Average Home Value in this Area
Purchase History
| Date | Buyer | Sale Price | Title Company |
|---|---|---|---|
| Hardin Richard D | -- | None Available | |
| Hardin Richard | $291,000 | Mid Valley Title & Escrow Co | |
| Leonard Lisa | -- | Mid Valley Title & Escrow Co | |
| Leonard Lisa | $298,000 | Mid Valley Title & Escrow Co | |
| Balken Eric J | $225,000 | Bidwell Title & Escrow Compa | |
| Bellin Ann M | -- | Mid Valley Title |
Source: Public Records
Mortgage History
| Date | Status | Borrower | Loan Amount |
|---|---|---|---|
| Previous Owner | Balken Eric J | $191,250 | |
| Previous Owner | Bellin Ann M | $50,000 |
Source: Public Records
Tax History Compared to Growth
Tax History
| Year | Tax Paid | Tax Assessment Tax Assessment Total Assessment is a certain percentage of the fair market value that is determined by local assessors to be the total taxable value of land and additions on the property. | Land | Improvement |
|---|---|---|---|---|
| 2025 | $2,252 | $207,089 | $57,921 | $149,168 |
| 2024 | $2,252 | $203,030 | $56,786 | $146,244 |
| 2023 | $2,226 | $199,050 | $55,673 | $143,377 |
| 2022 | $2,189 | $195,148 | $54,582 | $140,566 |
| 2021 | $2,148 | $191,322 | $53,512 | $137,810 |
| 2020 | $2,142 | $189,361 | $52,964 | $136,397 |
| 2019 | $2,104 | $185,649 | $51,926 | $133,723 |
| 2018 | $2,065 | $182,009 | $50,908 | $131,101 |
| 2017 | $2,023 | $178,441 | $49,910 | $128,531 |
| 2016 | $1,847 | $174,943 | $48,932 | $126,011 |
| 2015 | $1,847 | $172,316 | $48,197 | $124,119 |
| 2014 | $1,802 | $168,941 | $47,253 | $121,688 |
Source: Public Records
Map
Nearby Homes
- 1603 Plumas Way
- 1094 Manzanita Ave
- 9 Montclair Dr
- 1712 Sherman Ave
- 1420 Sherman Ave
- 2165 Ceres Ave
- 9 Trieste Way
- 1075 Tracy Ln
- 2 Kingston Cir
- 1407 Sunset Ave
- 1125 Sheridan Ave Unit 28
- 1125 Sheridan Ave Unit 56
- 16 Petaluma Ct
- 1276 Dale Way
- 1277 Howard Dr
- 498 E 8th Ave
- 1186 Patricia Dr
- 1705 Spruce Ave
- 1 Cottage Cir
- 1058 Stevie Joe Way
- 1620 Neal Dow Ave
- 1629 Neal Dow Ave
- 1748 Neal Dow Ave
- 1621 Neal Dow Ave
- 1168 E Lindo Ave
- 1639 Neal Dow Ave
- 1612 Plumas Way
- 1612 Neal Dow Ave
- 1731 Neal Dow Ave
- 1629 Downing Ave
- 1632 Plumas Way
- 1172 E Lindo Ave
- 1646 Plumas Way
- 1520 Neal Dow Ave
- 1741 Neal Dow Ave
- 1615 Downing Ave
- 1654 Plumas Way
- 5 Pinecrest Cir
- 1635 Downing Ave
- 1611 Downing Ave